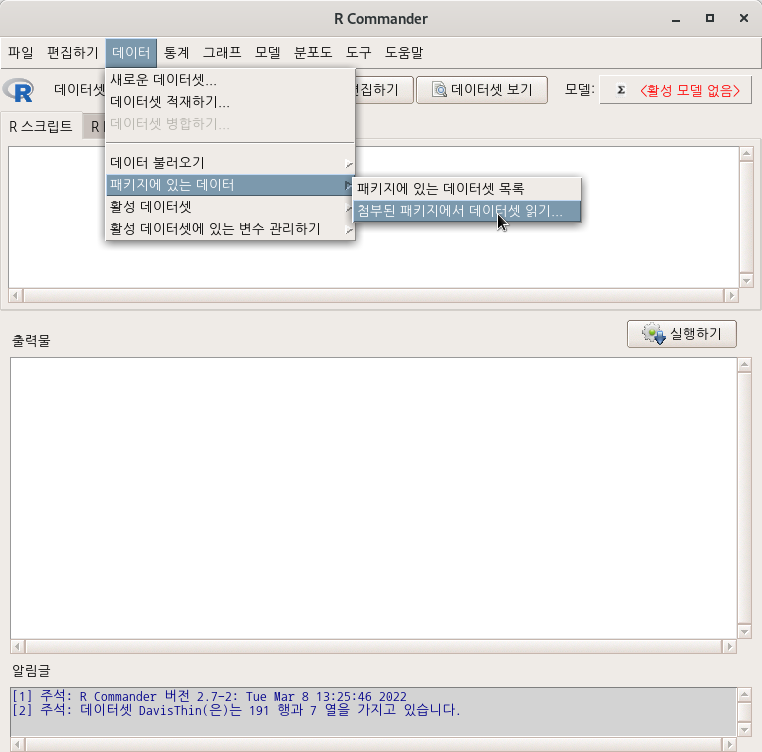
datasets::USArrests()
Linux 사례(MX 21)
Linux 사례 (MX 21)

data(USArrests, package="datasets")

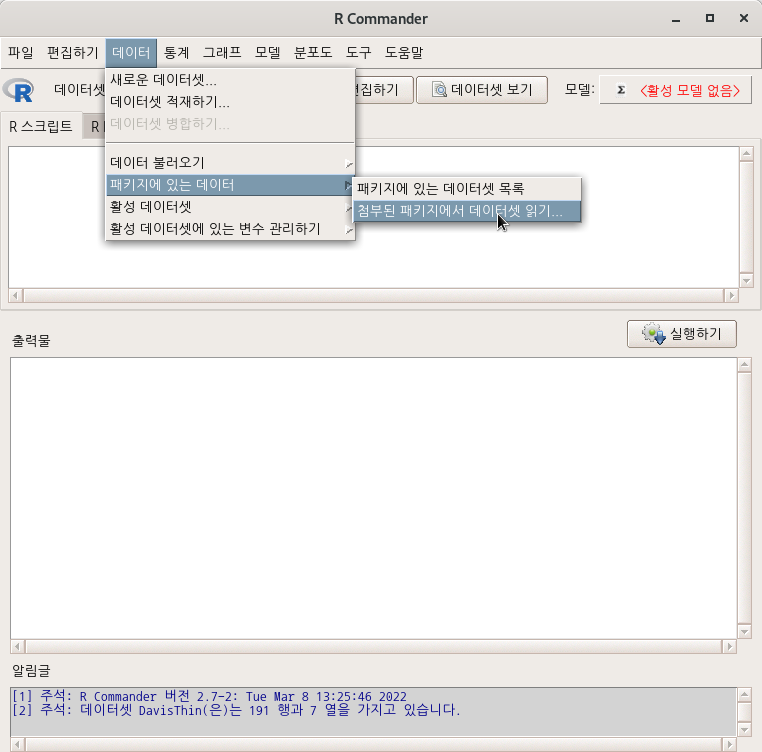
R Commander 화면 상단에서 <데이터셋 보기> 버튼을 누르면 아래와 같은 내부 구성을 확인할 수 있다.

Linux 사례 (MX 21)

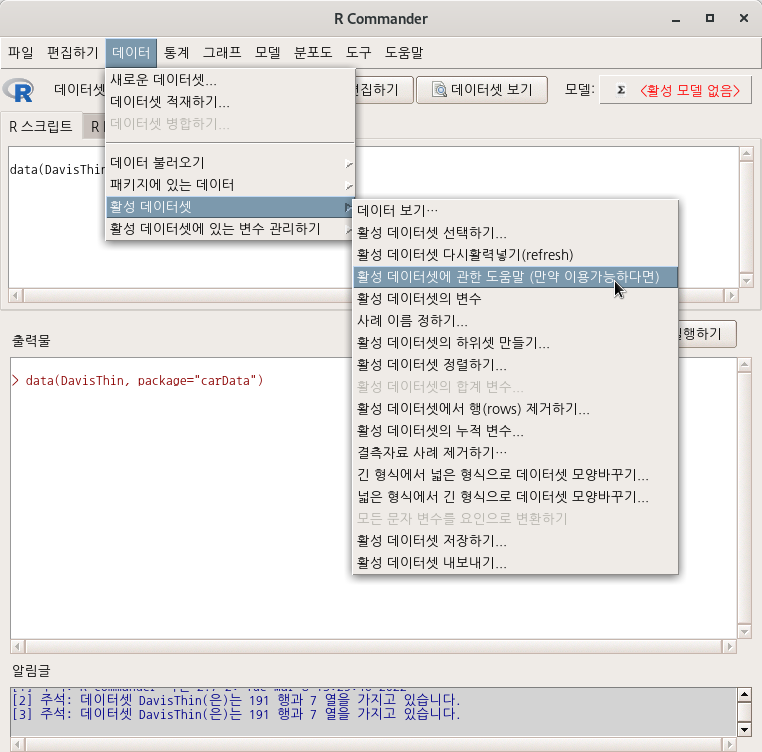
help("USArrests")

USArrests {datasets} R Documentation

Violent Crime Rates by US State

Description

This data set contains statistics, in arrests per 100,000 residents for assault, murder, and rape in each of the 50 US states in 1973. Also given is the percent of the population living in urban areas.

Usage

USArrests

Format

A data frame with 50 observations on 4 variables.

[,1] Murder numeric Murder arrests (per 100,000)
[,2] Assault numeric Assault arrests (per 100,000)
[,3] UrbanPop numeric Percent urban population
[,4] Rape numeric Rape arrests (per 100,000)

Note

USArrests contains the data as in McNeil's monograph. For the UrbanPop percentages, a review of the table (No. 21) in the Statistical Abstracts 1975 reveals a transcription error for Maryland (and that McNeil used the same “round to even” rule that R's round() uses), as found by Daniel S Coven (Arizona).

See the example below on how to correct the error and improve accuracy for the ‘<n>.5’ percentages.

Source

World Almanac and Book of facts 1975. (Crime rates).

Statistical Abstracts of the United States 1975, p.20, (Urban rates), possibly available as https://books.google.ch/books?id=zl9qAAAAMAAJ&pg=PA20.

References

McNeil, D. R. (1977) Interactive Data Analysis. New York: Wiley.

See Also

The state data sets.

Examples

summary(USArrests)

require(graphics)
pairs(USArrests, panel = panel.smooth, main = "USArrests data")

## Difference between 'USArrests' and its correction
USArrests["Maryland", "UrbanPop"] # 67 -- the transcription error
UA.C <- USArrests
UA.C["Maryland", "UrbanPop"] <- 76.6

## also +/- 0.5 to restore the original  <n>.5  percentages
s5u <- c("Colorado", "Florida", "Mississippi", "Wyoming")
s5d <- c("Nebraska", "Pennsylvania")
UA.C[s5u, "UrbanPop"] <- UA.C[s5u, "UrbanPop"] + 0.5
UA.C[s5d, "UrbanPop"] <- UA.C[s5d, "UrbanPop"] - 0.5

## ==> UA.C  is now a *C*orrected version of  USArrests

[Package datasets version 4.1.0 Index]

'Dataset_info > USArrests' 카테고리의 다른 글

USArrests 데이터셋 예제  (0) 2022.06.25

carData > Prestige

Linux 사례 (MX 21)
Linux 사례 (MX 21)

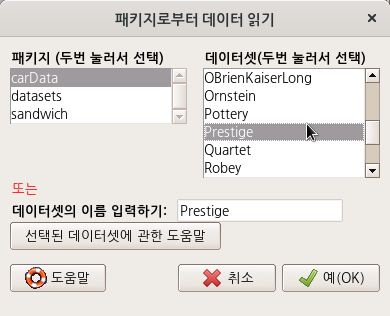
data(Prestige, package="carData")

Linux 사례 (MX 21)

help("Prestige")

Prestige {carData} R Documentation

Prestige of Canadian Occupations

Description

The Prestige data frame has 102 rows and 6 columns. The observations are occupations.

Usage

Prestige

Format

This data frame contains the following columns:

education

Average education of occupational incumbents, years, in 1971.

income

Average income of incumbents, dollars, in 1971.

women

Percentage of incumbents who are women.

prestige

Pineo-Porter prestige score for occupation, from a social survey conducted in the mid-1960s.

census

Canadian Census occupational code.

type

Type of occupation. A factor with levels (note: out of order): bc, Blue Collar; prof, Professional, Managerial, and Technical; wc, White Collar.

Source

Canada (1971) Census of Canada. Vol. 3, Part 6. Statistics Canada [pp. 19-1–19-21].

Personal communication from B. Blishen, W. Carroll, and C. Moore, Departments of Sociology, York University and University of Victoria.

References

Fox, J. (2016) Applied Regression Analysis and Generalized Linear Models, Third Edition. Sage.

Fox, J. and Weisberg, S. (2019) An R Companion to Applied Regression, Third Edition, Sage.


[Package carData version 3.0-4 Index]

'Dataset_info > Prestige' 카테고리의 다른 글

Prestige.csv  (0) 2022.02.22

carData > Moore

Linux 사례 (MX 21)
Linux 사례 (MX 21)

data(Moore, package="carData")

Linux 사례 (MX 21)

help("Moore")

Moore {carData} R Documentation

Status, Authoritarianism, and Conformity

Description

The Moore data frame has 45 rows and 4 columns. The data are for subjects in a social-psychological experiment, who were faced with manipulated disagreement from a partner of either of low or high status. The subjects could either conform to the partner's judgment or stick with their own judgment.

Usage

Moore

Format

This data frame contains the following columns:

partner.status

Partner's status. A factor with levels: high, low.

conformity

Number of conforming responses in 40 critical trials.

fcategory

F-Scale Categorized. A factor with levels (note levels out of order): high, low, medium.

fscore

Authoritarianism: F-Scale score.

Source

Moore, J. C., Jr. and Krupat, E. (1971) Relationship between source status, authoritarianism and conformity in a social setting. Sociometry 34, 122–134.

Personal communication from J. Moore, Department of Sociology, York University.

References

Fox, J. (2016) Applied Regression Analysis and Generalized Linear Models, Third Edition. Sage.

Fox, J. and Weisberg, S. (2019) An R Companion to Applied Regression, Third Edition, Sage.

+ Recent posts