모델 > 하위셋 모델 선택...
Models > Subset model selection...

datasets 패키지에 있는 swiss 데이터셋으로 연습해보자. swiss 데이터셋을 불러온다.
'데이터 > 패키지에 있는 데이터 > 첨부된 패키지에서 데이터셋 읽기' 메뉴 기능을 선택하여 datasets 패키지에 있는 swiss 데이터셋을 찾고 선택한다.
https://rcmdr.tistory.com/184
swiss 데이터셋
Dataset_info > swiss data(swiss, package="datasets") # swiss 데이터셋 불러오기 summary(swiss) # swiss 데이터셋 요약정보보기 str(swiss) # swiss 데이터셋 구조살펴보기 데이터셋의 내부는 다음과 같다:..
rcmdr.kr
'통계 > 적합성 모델 > 선형 모델...' 메뉴 기능을 사용하여 swiss 데이터셋의 변수들 중에서 Fertility를 반응변수로, 나머지를 추천된 설명변수 후보로 가정하고, 선형 모델을 아래와 같이 만든다.

data(swiss, package="datasets") # swisss 데이터셋 불러오기
LinearModel.1 <- lm(Fertility ~ Agriculture + Catholic + Education + Examination +
  Infant.Mortality, data=swiss) # 문제의식과 연관된 설명변수 후보들을 모두 선택하여 모형만들기
summary(LinearModel.1)
plot(regsubsets(Fertility ~ Agriculture + Catholic + Education + Examination +
  Infant.Mortality, data=swiss, nbest=1, nvmax=6), scale='bic')
                                # 하위셋 모델 선택 그림 만들기
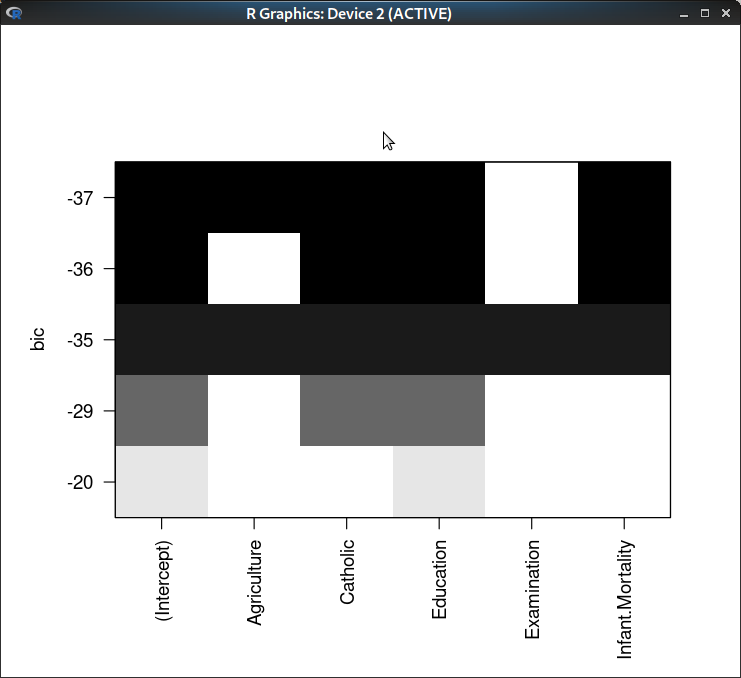
그래프에서 bic값이 가장 작은 숫자를 찾고, 이것과 연결된 설명변수 후보들 목록을 살펴보자. 검은색으로 표현된 것은 포함된 것, 흰색(공백)으로 표현된 것은 비포함된 것, 다른 말로 제거되어야 할 것이다. 그래프에서는 Examination 변수가 포함되지 않은 모형의 bic 값이 가장 작은 것을 알려준다.
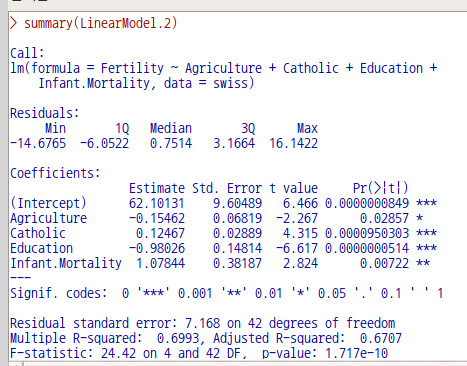
LinearModel.2 <- lm(Fertility ~ Agriculture + Catholic + Education + Infant.Mortality,
  data=swiss)              # Examination 변수를 제외한 추천 모형 만들기
summary(LinearModel.2)     # LinearModel.2의 요약 정보 보기
plot(regsubsets(Fertility ~ Agriculture + Catholic + Education + Infant.Mortality,
  data=swiss, nbest=1, nvmax=5), scale='bic')
                           # 추천된 하위셋 모델 점검하는 그림 만들기
