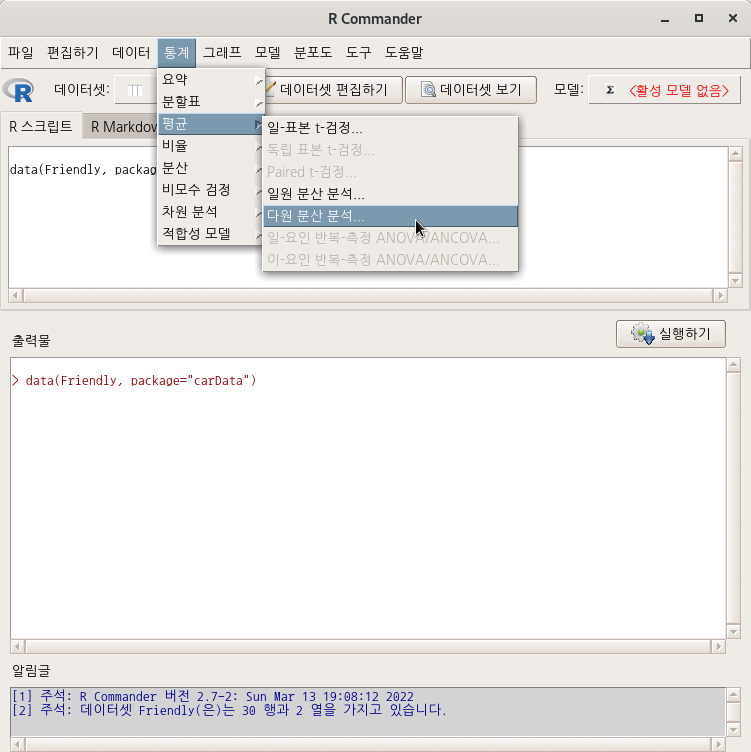
통계 > 평균 > 다원 분산 분석...
Statistics > Means > Multi-way ANOVA...

다중 분산 분석 (Multi-way ANOVA)은 두개 이상의 요인형 변수들의 작용으로 하나의 수치형 변수에 영향을 주었는가를 점검하는 통계기법이다.

data(Adler, package="carData")
help("Adler", package="carData")
AnovaModel.1 <- lm(rating ~ expectation*instruction, data=Adler, contrasts=list(expectation
="contr.Sum", instruction ="contr.Sum"))
Anova(AnovaModel.1)
Tapply(rating ~ expectation + instruction, mean, na.action=na.omit, data=Adler) # means
Tapply(rating ~ expectation + instruction, sd, na.action=na.omit, data=Adler) # std. deviations
xtabs(~ expectation + instruction, data=Adler) # counts
?Anova  # car패키지의 Anova 도움말 보기

## Two-Way Anova

mod <- lm(conformity ~ fcategory*partner.status, data=Moore,
  contrasts=list(fcategory=contr.sum, partner.status=contr.sum))
Anova(mod)
Anova(mod, type=3)  # note use of contr.sum in call to lm()

## One-Way MANOVA
## See ?Pottery for a description of the data set used in this example.

summary(Anova(lm(cbind(Al, Fe, Mg, Ca, Na) ~ Site, data=Pottery)))

## MANOVA for a randomized block design (example courtesy of Michael Friendly:
##  See ?Soils for description of the data set)

soils.mod <- lm(cbind(pH,N,Dens,P,Ca,Mg,K,Na,Conduc) ~ Block + Contour*Depth,
    data=Soils)
Manova(soils.mod)
summary(Anova(soils.mod), univariate=TRUE, multivariate=FALSE,
    p.adjust.method=TRUE)

## a multivariate linear model for repeated-measures data
## See ?OBrienKaiser for a description of the data set used in this example.

phase <- factor(rep(c("pretest", "posttest", "followup"), c(5, 5, 5)),
    levels=c("pretest", "posttest", "followup"))
hour <- ordered(rep(1:5, 3))
idata <- data.frame(phase, hour)
idata

mod.ok <- lm(cbind(pre.1, pre.2, pre.3, pre.4, pre.5,
                     post.1, post.2, post.3, post.4, post.5,
                     fup.1, fup.2, fup.3, fup.4, fup.5) ~  treatment*gender,
                data=OBrienKaiser)
(av.ok <- Anova(mod.ok, idata=idata, idesign=~phase*hour))

summary(av.ok, multivariate=FALSE)

## A "doubly multivariate" design with two  distinct repeated-measures variables
## (example courtesy of Michael Friendly)
## See ?WeightLoss for a description of the dataset.

imatrix <- matrix(c(
	1,0,-1, 1, 0, 0,
	1,0, 0,-2, 0, 0,
	1,0, 1, 1, 0, 0,
	0,1, 0, 0,-1, 1,
	0,1, 0, 0, 0,-2,
	0,1, 0, 0, 1, 1), 6, 6, byrow=TRUE)
colnames(imatrix) <- c("WL", "SE", "WL.L", "WL.Q", "SE.L", "SE.Q")
rownames(imatrix) <- colnames(WeightLoss)[-1]
(imatrix <- list(measure=imatrix[,1:2], month=imatrix[,3:6]))
contrasts(WeightLoss$group) <- matrix(c(-2,1,1, 0,-1,1), ncol=2)
(wl.mod<-lm(cbind(wl1, wl2, wl3, se1, se2, se3)~group, data=WeightLoss))
Anova(wl.mod, imatrix=imatrix, test="Roy")

## mixed-effects models examples:

## Not run:
	library(nlme)
	example(lme)
	Anova(fm2)

## End(Not run)

## Not run:
	library(lme4)
	example(glmer)
	Anova(gm1)

## End(Not run)'Statistics > Means' 카테고리의 다른 글
| 7. Two-factor repeated-measures ANOVA/ANCOVA (0) | 2022.06.30 |
|---|---|
| 6. One-factor repeated-measures ANOVA/ANCOVA... (0) | 2022.06.23 |
| 4. One-way ANOVA... (0) | 2022.03.07 |
| 3. Paired t-test... (0) | 2022.03.07 |
| 2. Independent samples t-test... (0) | 2022.03.07 |


