통계 > 차원 분석 > 군집 분석 > 위계 군집 분석...

Statistics > Dimensional analysis > Cluster analysis > Hierarchical cluster analysis...

Linux 사례 (MX 21)

datasets 패키지에 있는 USArrests 데이터셋을 활용해서, 위계 군집 분석을 연습해보자. 우선 USArrests 데이터셋을 활성화시킨다.

https://rcmdr.kr/144


USArrests 데이터셋

datasets > USArrests data(USArrests, package="datasets") R Commander 화면 상단에서 <데이터셋 보기> 버튼을 누르면 아래와 같은 내부 구성을 확인할 수 있다. help("USArrests") USArrests {datasets} R Do..

rcmdr.kr

<위계적 군집화> 창에서 아래와 같이 변수 네개를 모두 선택한다. 그리고, 기본으로 추천되는 HClust.1를 군집화 이름으로 사용하자. 

Linux 사례 (MX 21)

<선택기능> 창에서 기본설정된 사항들을 그대로 사용해보자. <군집화 방법>, <거리 측정>, <덴드로그램 그리기> 등을 살펴본다.

Linux 사례 (MX 21)

예(OK) 버튼을 누르면, 아래와 같은 그래픽 창이 등장한다.

Linux 사례 (MX 21)

data(USArrests, package="datasets")
HClust.1 <- hclust(dist(model.matrix(~-1 + Assault+Murder+Rape+UrbanPop, USArrests)) , method= 
  "ward")
plot(HClust.1, main= "Cluster Dendrogram for Solution HClust.1", xlab= 
  "Observation Number in Data Set USArrests", sub="Method=ward; Distance=euclidian")


통계 > 차원 분석 > 군집 분석 > k-평균 군집 분석...

Statistics > Dimensional analysis > Cluster analysis > k-means cluster analysis...

Windows 사례 (10 Pro)

datasets 패키지에서 제공하는 USArrests 데이터셋을 이용해보자.

https://rcmdr.tistory.com/144


USArrests 데이터셋

datasets > USArrests data(USArrests, package="datasets") R Commander 화면 상단에서 <데이터셋 보기> 버튼을 누르면 아래와 같은 내부 구성을 확인할 수 있다. help("USArrests") USArrests {datasets} R Do..

rcmdr.kr

데이터셋에 포함된 네개의 변수를 모두 선택한다.

Windows 사례 (10 Pro)

<선택기능> 창에서, 군집의 수를 3개, 초기값의 수를 5번으로, 최대 반복 횟수를 5회로 정해보자. 데이터셋에 추가될 변수 이름이 KMeans가 될 것이다. 아래 있는 선택사항에서 데이터셋에 군집 할당하기를 선택한다.

Windows 사례 (10 Pro)

위 화면에서 선택된 군집 행렬도(Bi-plot)이 아래와 같이 생산된다.

Windows 사례 (10 Pro)

USArrests 데이터셋에 변수 KMeans가 추가될 것이다. R Commander 상단에 있는 <데이터셋 보기> 버튼을 눌러보자. KMeans 변수는 요인형으로 1, 2, 3 이라는 세개의 군집을 표시한다.

Windows 사례 (10 Pro)

아래 화면은 다소 복잡해보일 것이다. 그러나 객체 .cluster가 만들어졌으며, 그 객체안에 있는 $size, $withinss, $tot.withinss, $betweenss 등의 정보를 차례를 보여준다고 생각하자.  그리고 biplot을 생산하고, USArrests 데이터셋에 KMeans라는 변수를 추가하는 것이다.

'Statistics > Dimensional analysis' 카테고리의 다른 글

5.3. Summarize hierarchical clustering...  (0) 2022.03.20
5.2. Hierarchical cluster analysis...  (0) 2022.03.20
3. factor analysis...  (0) 2022.03.08
2. Principal-components analysis...  (0) 2022.03.08
1. Scale reliability...  (0) 2022.03.08

carData::Adler

Linux 사례 (MX 21)

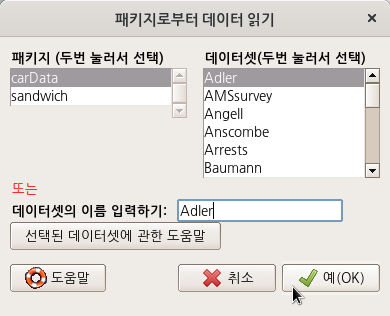
데이터 > 패키지에 있는 데이터 > 첨부된 패키지에서 데이터셋 읽기... 기능을 선택하면, 위와 같은 메뉴 창을 보게된다.

carData를 선택하여 두번 클릭하면, 오른쪽에 carData 패키지에 내장된 데이터셋 목록이 등장한다. Adler 데이터셋을 선택한다.

Linux 사례 (MX 21)

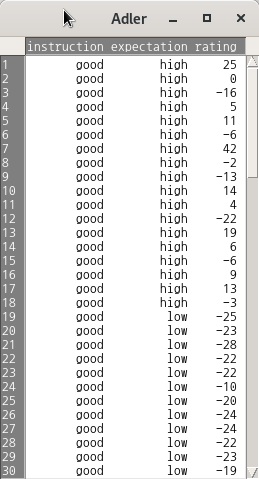
data(Adler, package="carData")  # Adler 데이터셋 활성화시키기
help("Adler", package="carData")# 도움말파일 열기

Linux사례 (MX 21)


Adler {carData} R Documentation

Experimenter Expectations

Description

The Adler data frame has 108 rows and 3 columns.

The “experimenters” were the actual subjects of the study. They collected ratings of the apparent success of people in pictures who were pre-selected for their average appearance of success. The experimenters were told prior to collecting data that particular subjects were either high or low in their tendency to rate appearance of success, and were instructed to get good data, scientific data, or were given no such instruction. Each experimenter collected ratings from 18 randomly assigned subjects. This version of the Adler data is taken from Erickson and Nosanchuk (1977). The data described in the original source, Adler (1973), have a more complex structure.

Usage

Adler

Format

This data frame contains the following columns:

instruction

a factor with levels: good, good data; none, no stress; scientific, scientific data.

expectation

a factor with levels: high, expect high ratings; low, expect low ratings.

rating

The average rating obtained.

Source

Erickson, B. H., and Nosanchuk, T. A. (1977) Understanding Data. McGraw-Hill Ryerson.

References

Adler, N. E. (1973) Impact of prior sets given experimenters and subjects on the experimenter expectancy effect. Sociometry 36, 113–126.

+ Recent posts