통계 > 분할표 > 다원표...

Statistics > Contingency tables >  Multi-way tables...

Linux 사례 (MX 21)

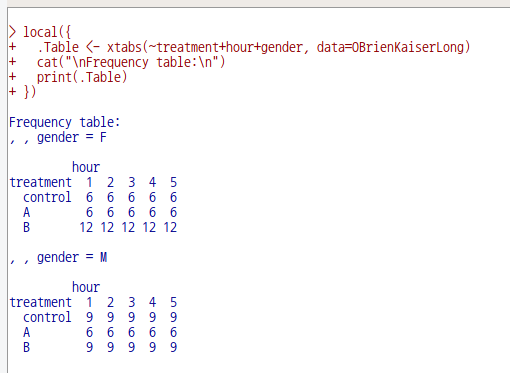
3개 이상의 요인형 변수를 포함하는 데이터셋이 활성화되면, '통계 > 분할표 > 다원표...' 메뉴 기능을 이용할 수 있다. 아래 메뉴 창에서 '통제 변수 (하나 이상 선택)'을 점검할 필요가 있다. 이원표를 만드는 기준 범주가 된다.

Linux 사례 (MX 21)
Linux 사례 (MX 21)


?xtabs  # stats 패키지의 xtabs 도움말 보기

## 'esoph' has the frequencies of cases and controls for all levels of
## the variables 'agegp', 'alcgp', and 'tobgp'.
xtabs(cbind(ncases, ncontrols) ~ ., data = esoph)
## Output is not really helpful ... flat tables are better:
ftable(xtabs(cbind(ncases, ncontrols) ~ ., data = esoph))
## In particular if we have fewer factors ...
ftable(xtabs(cbind(ncases, ncontrols) ~ agegp, data = esoph))

## This is already a contingency table in array form.
DF <- as.data.frame(UCBAdmissions)
## Now 'DF' is a data frame with a grid of the factors and the counts
## in variable 'Freq'.
DF
## Nice for taking margins ...
xtabs(Freq ~ Gender + Admit, DF)
## And for testing independence ...
summary(xtabs(Freq ~ ., DF))

## with NA's
DN <- DF; DN[cbind(6:9, c(1:2,4,1))] <- NA
DN # 'Freq' is missing only for (Rejected, Female, B)
tools::assertError(# 'na.fail' should fail :
     xtabs(Freq ~ Gender + Admit, DN, na.action=na.fail), verbose=TRUE)
op <- options(na.action = "na.omit") # the "factory" default
(xtabs(Freq ~ Gender + Admit, DN) -> xtD)
noC <- function(O) `attr<-`(O, "call", NULL)
ident_noC <- function(x,y) identical(noC(x), noC(y))
stopifnot(exprs = {
  ident_noC(xtD, xtabs(Freq ~ Gender + Admit, DN, na.action = na.omit))
  ident_noC(xtD, xtabs(Freq ~ Gender + Admit, DN, na.action = NULL))
})

xtabs(Freq ~ Gender + Admit, DN, na.action = na.pass)
## The Female:Rejected combination has NA 'Freq' (and NA prints 'invisibly' as "")
(xtNA <- xtabs(Freq ~ Gender + Admit, DN, addNA = TRUE)) # ==> count NAs
## show NA's better via  na.print = ".." :
print(xtNA, na.print= "NA")


## Create a nice display for the warp break data.
warpbreaks$replicate <- rep_len(1:9, 54)
ftable(xtabs(breaks ~ wool + tension + replicate, data = warpbreaks))

### ---- Sparse Examples ----

if(require("Matrix")) withAutoprint({
 ## similar to "nlme"s  'ergoStool' :
 d.ergo <- data.frame(Type = paste0("T", rep(1:4, 9*4)),
                      Subj = gl(9, 4, 36*4))
 xtabs(~ Type + Subj, data = d.ergo) # 4 replicates each
 set.seed(15) # a subset of cases:
 xtabs(~ Type + Subj, data = d.ergo[sample(36, 10), ], sparse = TRUE)

 ## Hypothetical two-level setup:
 inner <- factor(sample(letters[1:25], 100, replace = TRUE))
 inout <- factor(sample(LETTERS[1:5], 25, replace = TRUE))
 fr <- data.frame(inner = inner, outer = inout[as.integer(inner)])
 xtabs(~ inner + outer, fr, sparse = TRUE)
})

'Statistics > Contigency tables' 카테고리의 다른 글

3. Enter and analyze two-way table...  (0) 2022.06.28
Contingency tables  (0) 2022.02.14
1. Two-way table...  (0) 2022.02.14

통계 > 분할표 > 이원표 입력 및 분석하기...

Statistics > Contingency tables > Enter and analyze two-way table...

Linux 사례 (MX 21)

'통계 > 분할표 > 이원표 입력 및 분석하기...' 메뉴 기능을 선택하면 하위 창이 등장한다. '변수 이름', '행과 열의 수', '사례 수' 등을 입력할 수 있다. 아래의 내용은 'chisq.test' 함수 도움말 문서에 나오는 사례를 입력한다. 아래의 입력 스크립트를 참조 할 수 있다.

Linux 사례 (MX 21)
Linux 사례(MX 21)

.Table <- matrix(c(762,327,468,484,239,477), 2, 3, byrow=TRUE)
dimnames(.Table) <- list("Gender"=c("Female", "Male"), "Party"=c("Democrats", "Independent", 
  "Republican"))
.Table  # Counts
.Test <- chisq.test(.Table, correct=FALSE)
.Test
.Test$expected # Expected Counts

Linux 사례 (MX 21)


?chisq.test  # stats 패키지의  chisq.test 도움말 보기

## From Agresti(2007) p.39
M <- as.table(rbind(c(762, 327, 468), c(484, 239, 477)))
dimnames(M) <- list(gender = c("F", "M"),
                    party = c("Democrat","Independent", "Republican"))
(Xsq <- chisq.test(M))  # Prints test summary
Xsq$observed   # observed counts (same as M)
Xsq$expected   # expected counts under the null
Xsq$residuals  # Pearson residuals
Xsq$stdres     # standardized residuals


## Effect of simulating p-values
x <- matrix(c(12, 5, 7, 7), ncol = 2)
chisq.test(x)$p.value           # 0.4233
chisq.test(x, simulate.p.value = TRUE, B = 10000)$p.value
                                # around 0.29!

## Testing for population probabilities
## Case A. Tabulated data
x <- c(A = 20, B = 15, C = 25)
chisq.test(x)
chisq.test(as.table(x))             # the same
x <- c(89,37,30,28,2)
p <- c(40,20,20,15,5)
try(
chisq.test(x, p = p)                # gives an error
)
chisq.test(x, p = p, rescale.p = TRUE)
                                # works
p <- c(0.40,0.20,0.20,0.19,0.01)
                                # Expected count in category 5
                                # is 1.86 < 5 ==> chi square approx.
chisq.test(x, p = p)            #               maybe doubtful, but is ok!
chisq.test(x, p = p, simulate.p.value = TRUE)

## Case B. Raw data
x <- trunc(5 * runif(100))
chisq.test(table(x))            # NOT 'chisq.test(x)'!

'Statistics > Contigency tables' 카테고리의 다른 글

2. Multi-way tables...  (0) 2022.06.28
Contingency tables  (0) 2022.02.14
1. Two-way table...  (0) 2022.02.14

도움말 > R Markdown 사용하기

Help > Using R Markdown

Linux 사례 (MX 21)

'도움말 > R Markdown 사용하기' 메뉴 기능을 선택하면, RStudio사의 R Markdown 소개 사이트로 이동한다.

https://rmarkdown.rstudio.com/lesson-1.html


Introduction

© Copyright 2016 - 2020 RStudio, PBC

rmarkdown.rstudio.com


도움말 > Rcmdr에 대하여

Help > About Rcmdr

Linux 사례 (MX 21)

'도움말 > Rcmdr에 대하여' 메뉴 기능을 누르면 아래의 도움말을 웹브라우저에 띄운다.


Rcmdr-package {Rcmdr} R Documentation

R Commander

Description

A platform-independent basic-statistics GUI (graphical user interface) for R, based on the tcltk package.

Details

Package: Rcmdr
Version: 2.7-2
Date: 2021-12-31
Depends: R (>= 3.5.0), grDevices, graphics, methods, stats, utils, splines, RcmdrMisc (>= 2.7-1), car (>= 3.0-8), effects (>= 4.0-3)
Imports: tcltk, tcltk2 (>= 1.2-6), abind, relimp (>= 1.0-5), lme4
Suggests: aplpack, boot, colorspace, e1071, foreign, grid, Hmisc, knitr, lattice, leaps, lmtest, markdown, MASS, mgcv, multcomp (>= 0.991-2), nlme, nnet, nortest, readxl, rgl (>= 0.96.0), rmarkdown (>= 0.9.5), sem (>= 2.1-1)
ByteCompile: yes
License: GPL (>= 2)
URL: https://www.r-project.org, https://socialsciences.mcmaster.ca/jfox/Misc/Rcmdr/index.html, https://socialsciences.mcmaster.ca/jfox/Books/RCommander/
 

Translations

The R Commander comes with translations from English into several other languages. I am grateful to the following individuals and groups for preparing these translations: Basque, Jose Ramon Rueda; Brazilian Portuguese, Adriano Azevedo-Filho and Marilia Sa Carvalho; Catalan, Manel Salamero; Chinese, Tsungwu Ho, Frank C. S. Liu, and Cheng-shun Lee; Chinese (Simplified), Shulin Yang; French, Philippe Grosjean and Milan Bouchet-Valat; Galician, Anton Meixome; German: Friedrich Leisch and Gerhard Schoen; Greek: Vasileios Dimitropoulos, Anastasios Vikatos, and Andreas Vikatos; Indonesian, I Made Tirta; Italian, Stefano Calza; Japanese, Takaharu Araki; Korean, Chel Hee Lee, Dae-Heung Jang, and Shin Jong-Hwa; Polish, Lukasz Daniel; Romanian, Adrian Dusa; Russian, Alexey Shipunov; Slovenian, Jaro Lajovic and Matjaz Jeran; Spanish, Spanish R-UCA Project, http://knuth.uca.es/R.

Author(s)

John Fox <jfox@mcmaster.ca> and Milan Bouchet-Valat, with contributions from Liviu Andronic, Michael Ash, Theophilius Boye, Stefano Calza, Andy Chang, Vilmantas Gegzna, Philippe Grosjean, Richard Heiberger, G. Jay Kerns, Renaud Lancelot, Matthieu Lesnoff, Uwe Ligges, Samir Messad, Martin Maechler, Robert Muenchen, Duncan Murdoch, Erich Neuwirth, Dan Putler, Brian Ripley, Miroslav Ristic, Peter Wolf, and Kevin Wright.

Maintainer: John Fox <jfox@mcmaster.ca>

References

Fox, J. (2017) Using the R Commander: A Point-and-Click Interface for R. Chapman and Hall/CRC Press.

Fox, J. (2005) The R Commander: A Basic Statistics Graphical User Interface to R. Journal of Statistical Software, 14(9): 1–42.doi: 10.18637/jss.v014.i09.


[Package Rcmdr version 2.7-2 Index]

도움말 > R Commander 웹사이트

Help > R Commader website

Linux 사례(MX 21)
Linux 사례 (MX 21)


https://socialsciences.mcmaster.ca/jfox/Misc/Rcmdr/


R Commander

(click on the image for a larger view) The R Commander is a graphical user interface (GUI) to the free, open-source R statistical software. The R Commander is implemented as an R package, the Rcmdr package, which is freely available on CRAN (the R package

socialsciences.mcmaster.ca


도움말 > R Commander 소개

Help > Introduction to the R Commander

Help > Introduction to the R Commander (English version)


Linux 사례 (MX 21)

'도움말 > R Commander 소개'/ 'Help > Introduction to the R Commander' 메뉴 버튼을 누르면 Rcmdr에 내장된 Getting-Started-with-the-Rcmdr-ko.pdf 또는 Getting-Started-with-the-Rcmdr.pdf 파일이 등장한다. 영어 문서는 개발자 John Fox 교수님이 관리하는 것으로, 비록 기초 소개문서임에도 업그레이드시 문서에 잘 반영되고 있다.


Getting-Started-with-the-Rcmdr-ko.pdf라는 한글 문서에 관련된 이야기를 하고자 한다. 이 문서는 현재 관리되고 있지 않다. John Fox 교수님이 배포하는 Rcmdr 소스 파일에 포함되어 있지만, Rcmdr 업그레이드와 관련된 관리가 되지는 않는다. Fox 교수의 자상함 때문일지, 아니면 Rcmdr 패키지의 안정적 구조 설계에 의해서 버전이 업그레이드되어도 그 문서가 어느정도 유효하다고 생각하시는지 모르겠지만 말이다.


Linux 사례 (MX 21)


사실 이 문서는 다른 의미를 내포하고 있다. 이 문서의 첫 장 하단에 있는 주석에 보면, 이 문서의 작성자와 연락처가 나와있다. 

Linux 사례 (MX 21)

먼저, 신종화의 Rcmdr의 한글화 관리 경력을 입증해주는 기록이다. 둘째, @r-project.kr 이라는 도메인 주소와 이메일이 사용되었다는 기록이다. '한국 R 사용자회 (Korea R USER GROUP)' 이라는 이름으로 '초기멤버들'이 의욕적으로 활동하던 시기가 있었다. 이러저러한 이유로 r-project.kr 이라는 도메인 운영은 중지되고, '한국 R 사용자회'도 변화를 겪게 되었다. 


10년이 흘렀다. 이 문서에 대한 업데이트를 요즘 진지하게 고민중이다. 

도움말 > Commander 도움말

Help > Commander help

Linux 사례 (MX 21)

?Commander  # Rcmdr 패키지의 Commander 도움말 보기

http://omn.kr/1yenk

Linux 사례 (MX 21)

도움말 > R 도움말 시스템 시작하기

Help > Start R help system

Linux 사례 (MX 21)

R을 내려받아 설치하면, R을 공부하고 사용하는데 필요한 많은 문서와 도움말이 함께 설치된다. R Commander에서 '도움말 > R 도움말 시스템 시작하기' 메뉴 기능을 선택하면, 아래와 같이 웹 브라우저 창이 등장하고, 내장된 많은 문서와 도움말 기능을 이용할 수 있게 된다.

Linux 사례 (MX 21)

도움말 > R 웹사이트

Help > R website

Linux 사례 (MX 21)

웹 브라우저 창이 등장하고, R 재단의 홈페이지( https://www.r-project.org/ )가 열린다.

Linux 사례 (MX 21)

+ Recent posts