통계 > 평균 > 일-표본 t-검정...

Statistics > Means > Single-sample t-test...

Linux 사례 (MX 21)

datasets 패키지에 있는 sleep 데이터셋을 활용해보자.

https://rcmdr.tistory.com/132


sleep

Datasets > sleep data(sleep, package="datasets") summary(sleep) str(sleep) 데이터셋의 내부는 다음과 같다:

rcmdr.kr

<일-표본 t-검정...> 기능을 선택하면, 아래와 같은 선택 창으로 넘어간다.

sleep 데이터셋에서 일-표본 t-검정으로 점검할 수 있는 변수는 extra 하나가 보인다. 예(OK) 버튼을 누르자.

Linux 사례 (MX 21)

with(sleep, (t.test(extra, alternative='two.sided', mu=0.0, conf.level=.95)))

<대립 가설>에 관련된 선택사항에 변화를 주지 않았다. 아래 명령문과 같은 결과를 얻는다.

t.test(extra ~ 1, data = sleep)

Linux 사례 (MX 21)


?t.test  # stats 패키지의 t.test 도움말 보기

require(graphics)

t.test(1:10, y = c(7:20))      # P = .00001855
t.test(1:10, y = c(7:20, 200)) # P = .1245    -- NOT significant anymore

## Classical example: Student's sleep data
plot(extra ~ group, data = sleep)
## Traditional interface
with(sleep, t.test(extra[group == 1], extra[group == 2]))

## Formula interface
t.test(extra ~ group, data = sleep)

## Formula interface to one-sample test
t.test(extra ~ 1, data = sleep)

## Formula interface to paired test
## The sleep data are actually paired, so could have been in wide format:
sleep2 <- reshape(sleep, direction = "wide", 
                  idvar = "ID", timevar = "group")
t.test(Pair(extra.1, extra.2) ~ 1, data = sleep2)

'Statistics > Means' 카테고리의 다른 글

6. One-factor repeated-measures ANOVA/ANCOVA...  (0) 2022.06.23
5. Multi-way ANOVA...  (0) 2022.03.13
4. One-way ANOVA...  (0) 2022.03.07
3. Paired t-test...  (0) 2022.03.07
2. Independent samples t-test...  (0) 2022.03.07

datasets::sleep

Linux 사례 (MX 21)
Linux 사례 (MX 21)

data(sleep, package="datasets")
summary(sleep)
str(sleep)

Linux 사례 (MX 21)

데이터셋의 내부는 다음과 같다:

Linux 사례 (MX21)


sleep {datasets} R Documentation

Student's Sleep Data

Description

Data which show the effect of two soporific drugs (increase in hours of sleep compared to control) on 10 patients.

Usage

sleep

Format

A data frame with 20 observations on 3 variables.

[, 1] extra numeric increase in hours of sleep
[, 2] group factor drug given
[, 3] ID factor patient ID

Details

The group variable name may be misleading about the data: They represent measurements on 10 persons, not in groups.

Source

Cushny, A. R. and Peebles, A. R. (1905) The action of optical isomers: II hyoscines. The Journal of Physiology 32, 501–510.

Student (1908) The probable error of the mean. Biometrika, 6, 20.

References

Scheffé, Henry (1959) The Analysis of Variance. New York, NY: Wiley.

Examples

require(stats)
## Student's paired t-test
with(sleep,
     t.test(extra[group == 1],
            extra[group == 2], paired = TRUE))

## The sleep *prolongations*
sleep1 <- with(sleep, extra[group == 2] - extra[group == 1])
summary(sleep1)
stripchart(sleep1, method = "stack", xlab = "hours",
           main = "Sleep prolongation (n = 10)")
boxplot(sleep1, horizontal = TRUE, add = TRUE,
        at = .6, pars = list(boxwex = 0.5, staplewex = 0.25))

'Dataset_info > sleep' 카테고리의 다른 글

sleep 데이터셋 예제  (0) 2022.06.25

통계 > 적합성 모델 > 선형 모델...
Statistics > Fit models > Linear model...

Linux 사례 (MX 21)

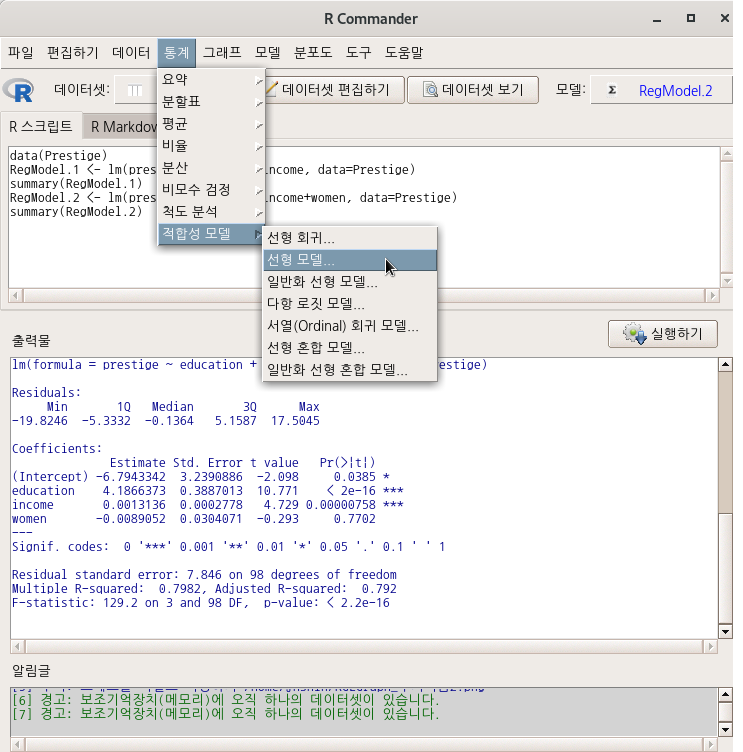
아래와 같은 <선형 모델> 선택 창에서 변수들을 선택할 수 있다. ‘통계 > 적합성 모델 >선형 회귀...‘기능의 <선형 회귀...>창과 달리 선택할 수 있는 변수에 'type [요인]'이 추가되어 있다.

carData 패키지에서 제공되는 Prestige 데이터셋에는 요인형 변수 type이 포함되어 있다. <선형 모델> 기능에는 요인형 변수를 함께 넣어서 계산할 수 있고, 표본을 모집단 크기에 비율적으로 맞추고자 사례 값에 가중치를 넣어서 계산하는 <Weights> 선택 기능이 있다. 그리고 변수를 선택하는 것을 뛰어넘어 변수들 사이의 관계성을 수식화 할 수 있는 <모델 공식> 기능이 포함되어 있다.

Linux 사례 (MX 21)

아래 <선형 모델> 창은 위의 모델 구성식과는 다른 방식을 제안한다. 직업의 사회적 권위 (prestige)에 대한 education + income + women + type 의 영향력을 계산하는 것이 아니라, education + log(income)의 결과와 type의 관계가 prestige 변수에 미치는 영향력을 계산하는 식이다.

Linux 사례 (MX 21)
LinearModel.1 <- lm(prestige ~ (education + log(income))*type, data=Prestige)
summary(LinearModel.1)
Linux 사례 (MX 21) - R Markdown 보고서 결과

'Statistics > Fit models' 카테고리의 다른 글

5. Ordinal regression model...  (0) 2022.06.24
6. Linear mixed model...  (0) 2022.06.23
4. Multinomial logit model...  (0) 2022.03.09
3. Generalized linear model...  (0) 2022.03.09
1. Linear regression...  (0) 2022.03.07

통계 > 적합성 모델 > 선형 회귀...

Statistics > Fit models > Linear regression...

Linux 사례 (MX 21)

carData 패키지에서 제공하는 Prestige 데이터셋을 불러와서 활성화시키자. 그러면, 위의 화면처럼 <선형 회귀...> 기능이 활성화될 것이다. 이 기능을 선택하면 아래와 같이 Prestige 데이터셋의 변수 목록이 등장하며, 회귀분석을 위한 구조적 설계를 시작한다.


교육연수(education)와 연소득(income)이 직업의 사회적권위(prestige)에 영향을 미치는가? 어떤 영향을 미치는가? 등의 문제의식을 통계적으로 점검한다고 해보자. 교육연수와 연소득은 설명 변수일 것이며, 직업의 사회적 권위는 이 두개의 설명 변수로부터 영향을 받는 반응 변수가 될 것이다. 한편, <모델 이름 입력하기:>에는 RegModel.1이 자동적으로 추천된다. 여러 개의 모델을 만들어 점검하는 경우, 지속적으로 일련번호가 추가된다. 분석가가 자유롭게 모델 이름을 정할 수 있다.

Linux 사례 (MX 21)

예(OK) 버튼을 누르면, R Commander 화면 상단에 있는 <모델:>옆에 파란색으로 RegModel.1이 등장한다.

Linux 사례 (MX 21)

RegModel.1 <- lm(prestige~education+income, data=Prestige)

summary(RegModel.1)

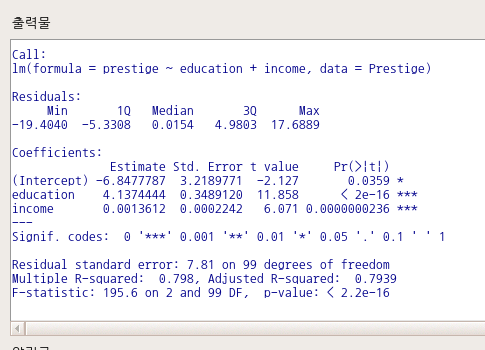
R Commander의 출력 창에는 만든 선형 회귀 모델의 결과가 출력된다.

Linux 사례 (MX 21)

'Statistics > Fit models' 카테고리의 다른 글

5. Ordinal regression model...  (0) 2022.06.24
6. Linear mixed model...  (0) 2022.06.23
4. Multinomial logit model...  (0) 2022.03.09
3. Generalized linear model...  (0) 2022.03.09
2. Linear model...  (0) 2022.03.07

그래프 > 그래프를 파일로 저장하기 > 3차원 RGL 그래프...
Graphs > Save graph to file > 3D RGL graph...

Linux 사례 (MX 21)
Linux 사례 (MX 21)

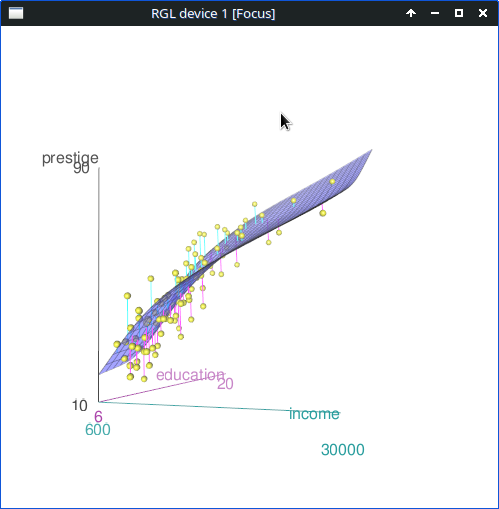
위의 그래프는 carData 패키지에서 제공하는 Prestige 데이터셋을 활용하여 만들었다. 3차원 그래프가 만들어졌다면, <3차원 RGL 그래프...> 기능이 활성화된다. 그리고 그 기능을 마우스로 선택하면 아래와 같은 경로, 파일이름, 형식을 추천하는 메뉴 창이 등장한다.

Linux 사례 (MX 21)
rgl.snapshot("/home/jhshin/RGLGraph_추가이름2.png")

'Graphs > Save graph to file' 카테고리의 다른 글

2. As PDF/Postscript/EPS...  (0) 2022.02.27
1. As bitmap...  (0) 2022.02.27

그래프 > 3D 그래프 > 그래프를 파일로 저장하기
Graphs > 3D graph > Save graph to file

Linux 사례 (MX 21)
Linux 사례 (MX 21)

carData 패키지에서 제공하는 Prestige 데이터셋을 활용하여 만든 3차원 산점도이다. 위와 같이 3차원 그래프를 만들었다면, <그래프를 파일로 저장하기> 기능이 활성화될 것이다. 이 기능을 선택하면, 아래와 같이 저장경로와 추천하는 파일이름과 형식이 제공된다.

Linux 사례 (MX 21)
rgl.snapshot("/home/jhshin/RGLGraph_추가이름1.png")

'Graphs > 3D graph' 카테고리의 다른 글

2. Identify observations with mouse  (0) 2022.03.06
1. 3D scatterplot  (0) 2022.03.06

마우스로 관찰치 식별하기

Graphs > 3D graph > Identify observations with mouse

Linux 사례 (MX 21)


Linux 사례 (MX 21)

'Graphs > 3D graph' 카테고리의 다른 글

3. Save graph to file  (0) 2022.03.07
1. 3D scatterplot  (0) 2022.03.06

3차원 산점도...

Graphs > 3D graph > 3D scatterplot

Linux 사례 (MX 21)

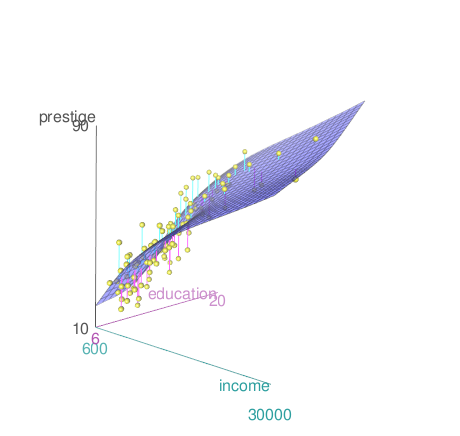
carData 패키지에 있는 Prestige 데이터셋을 활성화시키자. 교육연수와 연소득이 직업의 사회적 권위에 미치는 영향을 점검한다고 생각하자. <설명 변수 (두개 선택)>에 education, income을 <반응 변수 (한개 선택)>에 prestige 변수를 선택한다.

Linux 사례 (MX 21)

<선택기능> 창에서 '축(axis) 규모 보이기', '표면 그리드 선 보이기'를 선택하고, <표면 적합화 방법>에서 '평활 회귀'를 선택해본다.

Linux 사례 (MX 21)

scatter3d(prestige~education+income, data=Prestige, 
	fit="smooth", residuals=TRUE, bg="white", 
    axis.scales=TRUE, grid=TRUE, ellipsoid=FALSE)

아래 그래픽장치 창에 등장하는 3차원 산점도는 회전을 시켜서 최적의 시점(perspective)을 찾을 수 있다.

Linux 사례 (MX 21)


?scatter3d  # car 패키지의 scatter3d 도움말 보기

    if(interactive() && require(rgl) && require(mgcv)){
scatter3d(prestige ~ income + education, data=Duncan, id=list(n=3))
Sys.sleep(5) # wait 5 seconds
scatter3d(prestige ~ income + education | type, data=Duncan)
Sys.sleep(5)
scatter3d(prestige ~ income + education | type, surface=FALSE,
	ellipsoid=TRUE, revolutions=3, data=Duncan)
scatter3d(prestige ~ income + education, fit=c("linear", "additive"),
	data=Prestige)
Sys.sleep(5)
scatter3d(prestige ~ income + education | type,
    radius=(1 + women)^(1/3), data=Prestige)
	}
	## Not run: 
# drag right mouse button to identify points, click right button in open area to exit
scatter3d(prestige ~ income + education, data=Duncan, id=list(method="identify"))
scatter3d(prestige ~ income + education | type, data=Duncan, id=list(method="identify"))
    
## End(Not run)

'Graphs > 3D graph' 카테고리의 다른 글

3. Save graph to file  (0) 2022.03.07
2. Identify observations with mouse  (0) 2022.03.06

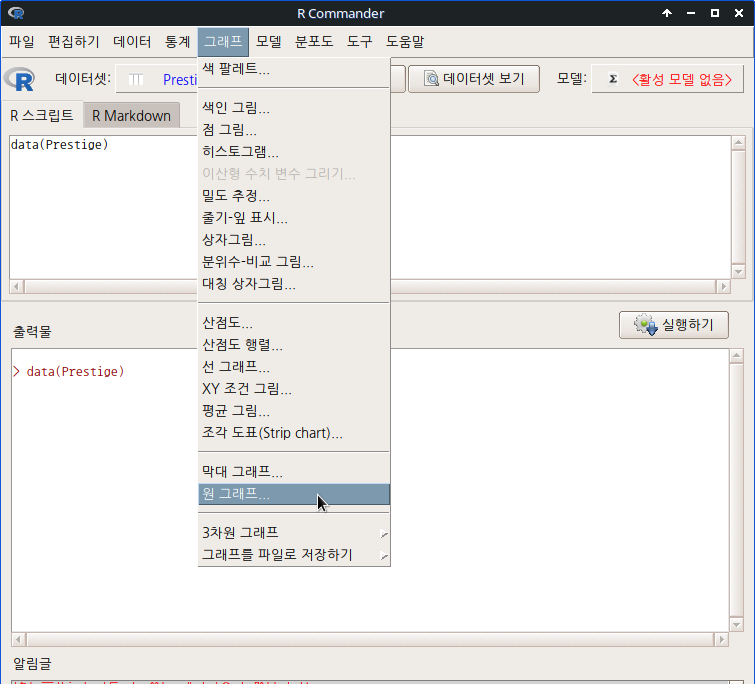
그래프 > 원 그래프...
Graphs > Pie chart...

Linux 사례 (MX 21)

carData 패키지에서 Prestige 데이터셋을 선택하여 활성화시키자. Prestige 데이터셋에는 요인형 변수가 type 하나이다. 원 그래프는 요인형 변수를 시각화할 때 사용하는 기법의 하나이다. <색깔 선택>에서 '색깔 팔레트에서'를 선택하고 <그림 이름표>에 내용을 이해하는데 효과적인 이름표와 제목을 입력한다.

Linux 사례 (MX 21)

with(Prestige, piechart(type, xlab="type (직업유형)", ylab="", 
main="1971년 캐나다 직업군의 유형 비율", col=palette()[2:4], scale="percent"))

Linux 사례 (MX 21)


?pie  # graphics 패키지의 pie 도움말 보기

require(grDevices)
pie(rep(1, 24), col = rainbow(24), radius = 0.9)

pie.sales <- c(0.12, 0.3, 0.26, 0.16, 0.04, 0.12)
names(pie.sales) <- c("Blueberry", "Cherry",
    "Apple", "Boston Cream", "Other", "Vanilla Cream")
pie(pie.sales) # default colours
pie(pie.sales, col = c("purple", "violetred1", "green3",
                       "cornsilk", "cyan", "white"))
pie(pie.sales, col = gray(seq(0.4, 1.0, length.out = 6)))
pie(pie.sales, density = 10, angle = 15 + 10 * 1:6)
pie(pie.sales, clockwise = TRUE, main = "pie(*, clockwise = TRUE)")
segments(0, 0, 0, 1, col = "red", lwd = 2)
text(0, 1, "init.angle = 90", col = "red")

n <- 200
pie(rep(1, n), labels = "", col = rainbow(n), border = NA,
    main = "pie(*, labels=\"\", col=rainbow(n), border=NA,..")

## Another case showing pie() is rather fun than science:
## (original by FinalBackwardsGlance on http://imgur.com/gallery/wWrpU4X)
pie(c(Sky = 78, "Sunny side of pyramid" = 17, "Shady side of pyramid" = 5),
    init.angle = 315, col = c("deepskyblue", "yellow", "yellow3"), border = FALSE)

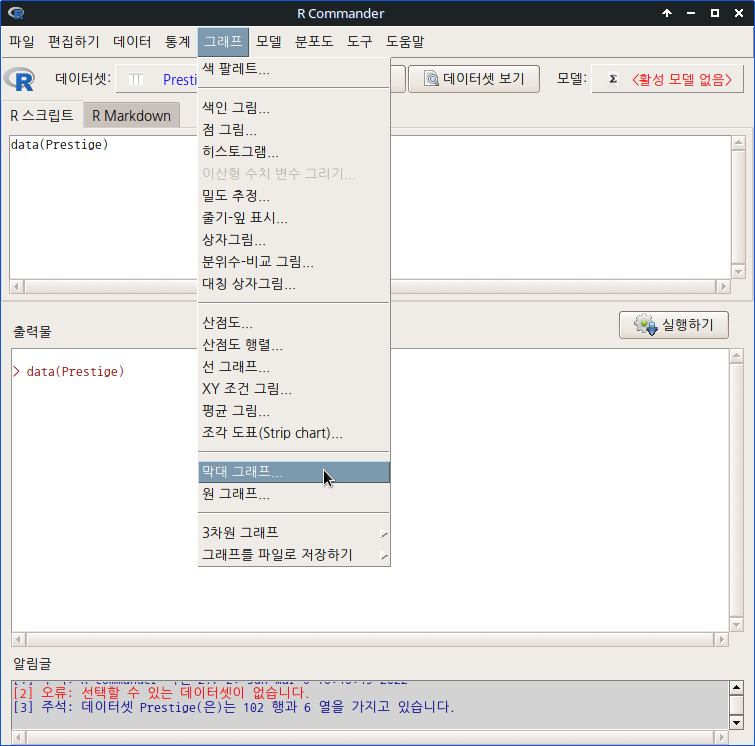
그래프 > 막대 그래프...
Graphs > Bar graph...

Linux 사례 (MX 21)

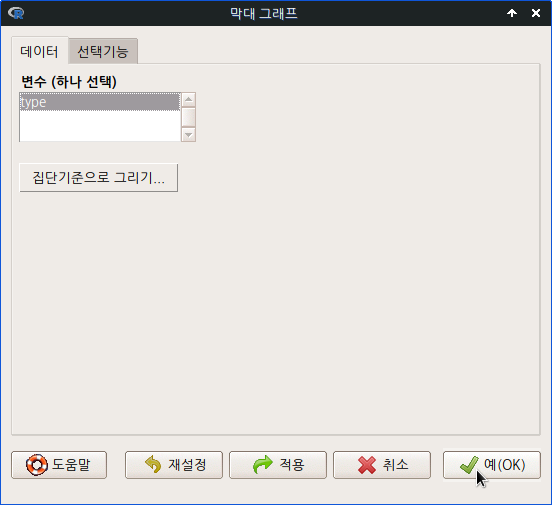
carData 패키지에 있는 Prestige 데이터셋을 활성화시키자. Prestige 데이터셋에는 요인형 변수가 한개 있다. type 변수인데 자동으로 선택된다. 만약 두개 이상이라면, 그 아래 있는 <집단 기준으로 그리기...>에서 추가적인 요인형변수를 선택할 수 있다.

Linux 사례 (MX 21)

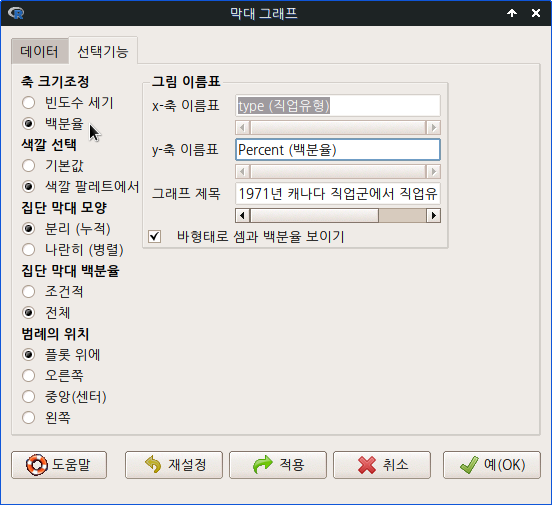
<선택기능> 창에 있는 <축 크기조정>에서 '백분율'을 선택하자. <색깔 선택>에서 '색깔 팔레트에서'를 선택하자. 그리고 <그림 이름표>에 그래프를 이해하는 데 효과적인 이름표와 제목을 입력하자.

Linux 사례 (MX 21)

with(Prestige, Barplot(type, xlab="type (직업유형)", ylab="Percent", 
  main="1971년 캐나다 직업군에서 직업유형별 막대그래프", 
  col=palette()[2], scale="percent", label.bars=TRUE))

아래와 같이 그래픽장치 창에 막대 그래프가 출력된다.

Linux 사례 (MX 21)


?Barplot  # RcmdrMisc 패키지의 Barplot 도움말 보기

with(Mroz, {
  Barplot(wc)
  Barplot(wc, col="lightblue", label.bars=TRUE)
  Barplot(wc, by=hc)
  Barplot(wc, by=hc, scale="percent", label.bars=TRUE)
  Barplot(wc, by=hc, style="parallel", 
    scale="percent", legend.pos="center")
})

+ Recent posts