통계 > 요약 > 정규성 검정...

Statistics > Summaries > Test of normality...


Linux 사례 (Ubuntu 18.04)

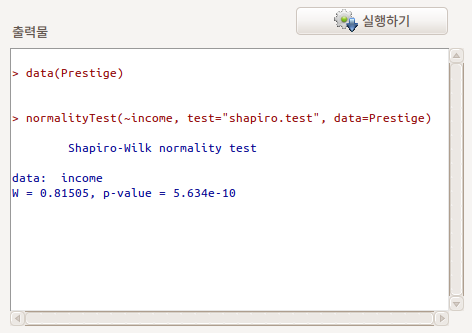
수치형(numeric, integer) 변수들 중에서 하나를 선택한다. 기본 설정에 Shapiro-Wilk의 정규성 검정법이 선택되어 있다. 수입(연봉)의 사례들이 정규 분포를 이루고 있는가를 확인하고자, 변수 income을 선택하고 예(OK) 버튼을 누른다.

Linux 사례 (Ubuntu 18.04)

normalityTest()를 사용한다.

Linux 사례 (Ubuntu 18.04)


normalityTest(~education, test="shapiro.test", data=Prestige)

Linux 사례 (MX 21)


?normalityTest  # RcmdrMisc 패키지의 normalityTest 도움말 보기

data(Prestige, package="car")
  with(Prestige, normalityTest(income))
  normalityTest(income ~ type, data=Prestige, test="ad.test")
  normalityTest(~income, data=Prestige, test="pearson.test", n.classes=5)

'Statistics > Summaries' 카테고리의 다른 글

9. Transform toward normality...  (0) 2022.06.19
7. Correlation test...  (0) 2022.02.13
6. Correlation matrix...  (0) 2022.02.13
5. Table of Statistics...  (0) 2022.02.13
4. Count missing observations  (0) 2022.02.13

통계 > 요약 > 상관 검정...
Statistics > Summaries > Correlation test...

Linux 사례 (Ubuntu 18.04)

상관 검정은 두 변수를 구성하는 사례값들 사이에 어떤 방향의 관계성이 있는지를 통계학적으로 확인하고자 할 때 사용한다. 아래는Prestige 데이터셋에서 교육수준과 수입(연봉) 사이에 어떤 관계성이 있는지를 확인하고자 한다. education과 income 변수를 선택하고, 예(OK) 버튼을 누른다.

Linux 사례 (Ubuntu 18.04)

상관의 유형 중에서 Pearson product-moment (피어슨 적률상관), 대립 가설에는 양측이 기본으로 설정되어 있다. 이 설정을 바탕으로 상관 검증의 결과를 출력하면 아래와 같다:

Linux 사례 (Ubuntu 18.04)

cor.test() 함수를 활용한다.


?cor.test  # stats 패키지의 cor.test 도움말 보기

## Hollander & Wolfe (1973), p. 187f.
## Assessment of tuna quality.  We compare the Hunter L measure of
##  lightness to the averages of consumer panel scores (recoded as
##  integer values from 1 to 6 and averaged over 80 such values) in
##  9 lots of canned tuna.

x <- c(44.4, 45.9, 41.9, 53.3, 44.7, 44.1, 50.7, 45.2, 60.1)
y <- c( 2.6,  3.1,  2.5,  5.0,  3.6,  4.0,  5.2,  2.8,  3.8)

##  The alternative hypothesis of interest is that the
##  Hunter L value is positively associated with the panel score.

cor.test(x, y, method = "kendall", alternative = "greater")
## => p=0.05972

cor.test(x, y, method = "kendall", alternative = "greater",
         exact = FALSE) # using large sample approximation
## => p=0.04765

## Compare this to
cor.test(x, y, method = "spearm", alternative = "g")
cor.test(x, y,                    alternative = "g")

## Formula interface.
require(graphics)
pairs(USJudgeRatings)
cor.test(~ CONT + INTG, data = USJudgeRatings)

'Statistics > Summaries' 카테고리의 다른 글

9. Transform toward normality...  (0) 2022.06.19
8. Test of normality...  (0) 2022.02.13
6. Correlation matrix...  (0) 2022.02.13
5. Table of Statistics...  (0) 2022.02.13
4. Count missing observations  (0) 2022.02.13

통계 > 요약 > 상관 행렬...
Statistics > Summaries > Correlation matrix...

Linux 사례 (Ubuntu 18.04)

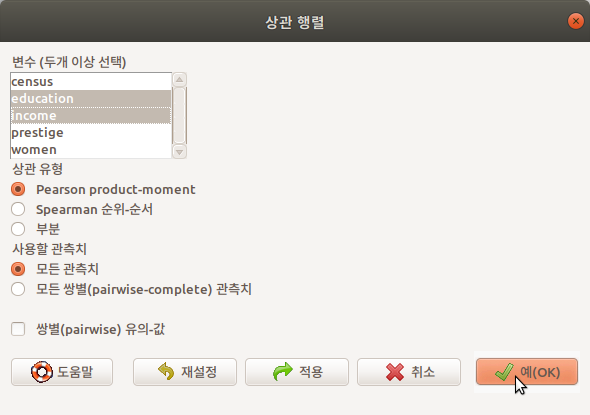
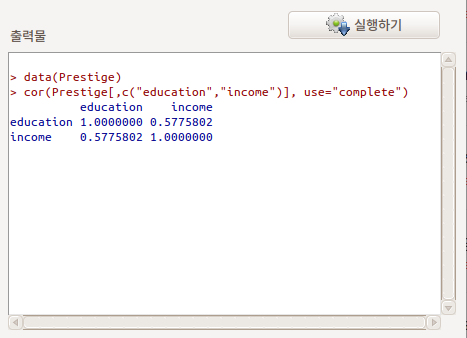
상관 행렬은 두개 이상의 변수를 선택해야 한다. Prestige 데이터셋에서 교육수준과 연봉(수입)의 관계에 대한 관심에서 이 두 변수를 선택하고, 예(OK) 버튼을 누른다.

Linux 사례 (Ubuntu 18.04)


Linux 사례 (Ubuntu 18.04)

출력 창을 보면, cor() 함수가 사용되었음을 알 수 있다.


?rcorr.adjust  #RcmdrMisc 패키지의 rcorr.adjust 도움말 보기

if (require(car)){
    data(Mroz)
    print(rcorr.adjust(Mroz[,c("k5", "k618", "age", "lwg", "inc")]))
    print(rcorr.adjust(Mroz[,c("k5", "k618", "age", "lwg", "inc")], type="spearman"))
    }

'Statistics > Summaries' 카테고리의 다른 글

8. Test of normality...  (0) 2022.02.13
7. Correlation test...  (0) 2022.02.13
5. Table of Statistics...  (0) 2022.02.13
4. Count missing observations  (0) 2022.02.13
3. Frequency distributions...  (0) 2022.02.13

+ Recent posts