MASS::housing()
require(MASS)
?housing  # housing 데이터셋 도움말 보기

# 아래는 example(housing) 입니다.

options(contrasts = c("contr.treatment", "contr.poly"))

# Surrogate Poisson models
house.glm0 <- glm(Freq ~ Infl*Type*Cont + Sat, family = poisson,
                  data = housing)
## IGNORE_RDIFF_BEGIN
summary(house.glm0, cor = FALSE)
## IGNORE_RDIFF_END

addterm(house.glm0, ~. + Sat:(Infl+Type+Cont), test = "Chisq")

house.glm1 <- update(house.glm0, . ~ . + Sat*(Infl+Type+Cont))
summary(house.glm1, cor = FALSE)

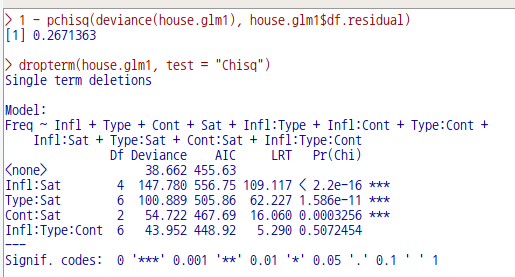
1 - pchisq(deviance(house.glm1), house.glm1$df.residual)

dropterm(house.glm1, test = "Chisq")

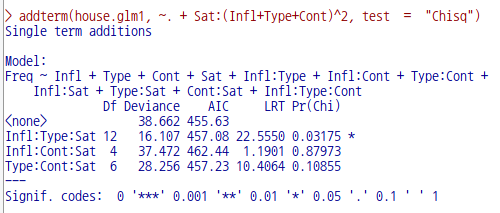
addterm(house.glm1, ~. + Sat:(Infl+Type+Cont)^2, test  =  "Chisq")

hnames <- lapply(housing[, -5], levels) # omit Freq
newData <- expand.grid(hnames)
newData$Sat <- ordered(newData$Sat)
house.pm <- predict(house.glm1, newData,
                    type = "response")  # poisson means
house.pm <- matrix(house.pm, ncol = 3, byrow = TRUE,
                   dimnames = list(NULL, hnames[[1]]))
house.pr <- house.pm/drop(house.pm %*% rep(1, 3))
cbind(expand.grid(hnames[-1]), round(house.pr, 2))

# Iterative proportional scaling
loglm(Freq ~ Infl*Type*Cont + Sat*(Infl+Type+Cont), data = housing)


# multinomial model
library(nnet)
(house.mult<- multinom(Sat ~ Infl + Type + Cont, weights = Freq,
                       data = housing))
house.mult2 <- multinom(Sat ~ Infl*Type*Cont, weights = Freq,
                        data = housing)
anova(house.mult, house.mult2)

house.pm <- predict(house.mult, expand.grid(hnames[-1]), type = "probs")
cbind(expand.grid(hnames[-1]), round(house.pm, 2))

# proportional odds model
house.cpr <- apply(house.pr, 1, cumsum)
logit <- function(x) log(x/(1-x))
house.ld <- logit(house.cpr[2, ]) - logit(house.cpr[1, ])
(ratio <- sort(drop(house.ld)))
mean(ratio)

(house.plr <- polr(Sat ~ Infl + Type + Cont,
                   data = housing, weights = Freq))

house.pr1 <- predict(house.plr, expand.grid(hnames[-1]), type = "probs")
cbind(expand.grid(hnames[-1]), round(house.pr1, 2))

Fr <- matrix(housing$Freq, ncol  =  3, byrow = TRUE)
2*sum(Fr*log(house.pr/house.pr1))

house.plr2 <- stepAIC(house.plr, ~.^2)
house.plr2$anova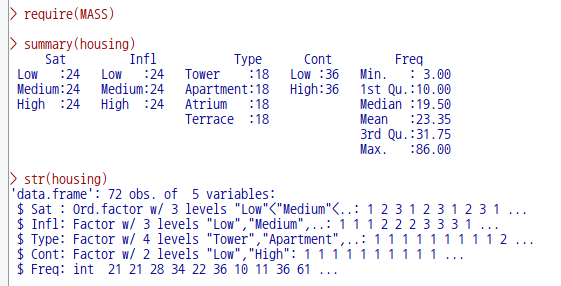
house.glm0 <- glm(Freq ~ Infl*Type*Cont + Sat, family = poisson, data = housing)
summary(house.glm0, cor = FALSE)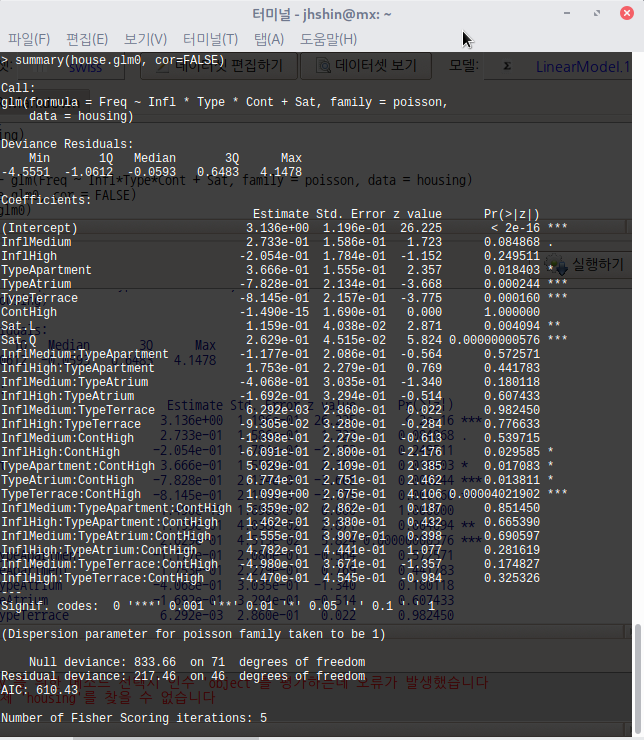

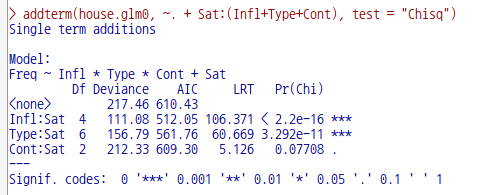
house.glm1 <- update(house.glm0, . ~ . + Sat*(Infl+Type+Cont))
summary(house.glm1, cor = FALSE)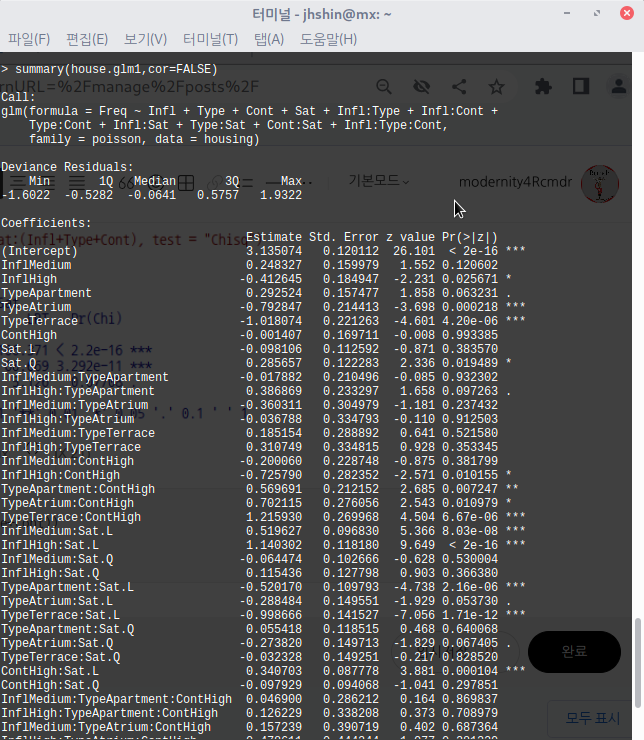

# multinomial model
library(nnet)
house.mult<- multinom(Sat ~ Infl + Type + Cont, weights = Freq,
                       data = housing)
house.mult2 <- multinom(Sat ~ Infl*Type*Cont, weights = Freq,
                        data = housing)
anova(house.mult, house.mult2)
Anova(house.mult2, type="II")

house.plr <- polr(Sat ~ Infl + Type + Cont,
                   data = housing, weights = Freq)
house.plr2 <- stepAIC(house.plr, ~.^2)
house.plr2$anova

'Dataset_info > housing' 카테고리의 다른 글
| housing 데이터셋 (0) | 2022.06.24 |
|---|


