모델 > 하위셋 모델 선택...
Models > Subset model selection...

Linux 사례 (MX 21)

datasets 패키지에 있는 swiss 데이터셋으로 연습해보자. swiss 데이터셋을 불러온다.
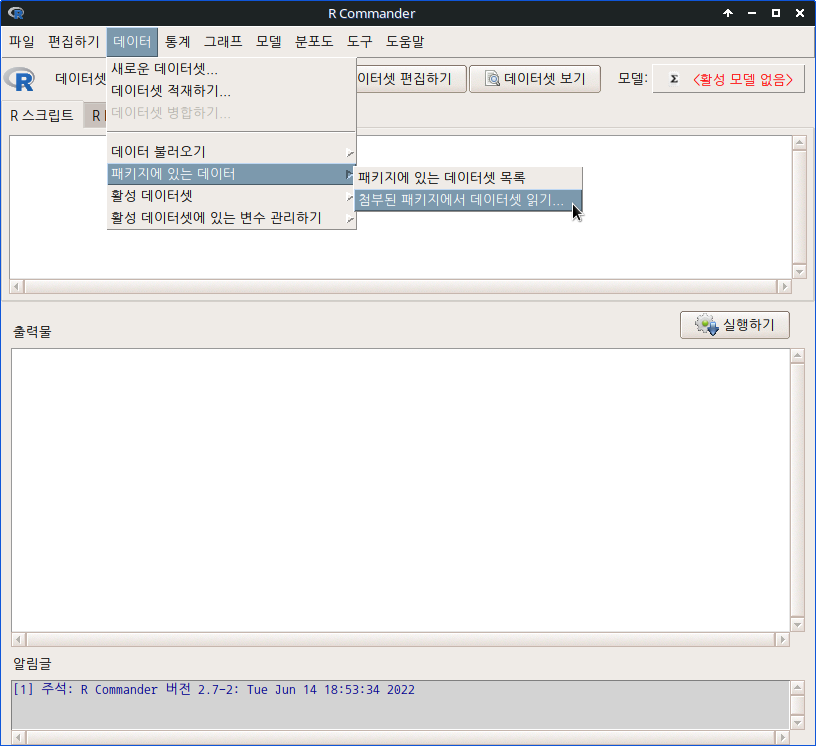
'데이터 > 패키지에 있는 데이터 > 첨부된 패키지에서 데이터셋 읽기' 메뉴 기능을 선택하여 datasets 패키지에 있는 swiss 데이터셋을 찾고 선택한다.
https://rcmdr.tistory.com/184

swiss 데이터셋

Dataset_info > swiss data(swiss, package="datasets") # swiss 데이터셋 불러오기 summary(swiss) # swiss 데이터셋 요약정보보기 str(swiss) # swiss 데이터셋 구조살펴보기 데이터셋의 내부는 다음과 같다:..

rcmdr.kr

'통계 > 적합성 모델 > 선형 모델...' 메뉴 기능을 사용하여 swiss 데이터셋의 변수들 중에서 Fertility를 반응변수로, 나머지를 추천된 설명변수 후보로 가정하고, 선형 모델을 아래와 같이 만든다.

Linux 사례 (MX 21)
data(swiss, package="datasets") # swisss 데이터셋 불러오기 
LinearModel.1 <- lm(Fertility ~ Agriculture + Catholic + Education + Examination + 
  Infant.Mortality, data=swiss) # 문제의식과 연관된 설명변수 후보들을 모두 선택하여 모형만들기
summary(LinearModel.1)
plot(regsubsets(Fertility ~ Agriculture + Catholic + Education + Examination + 
  Infant.Mortality, data=swiss, nbest=1, nvmax=6), scale='bic')
                                # 하위셋 모델 선택 그림 만들기
Linux 사례 (MX 21)

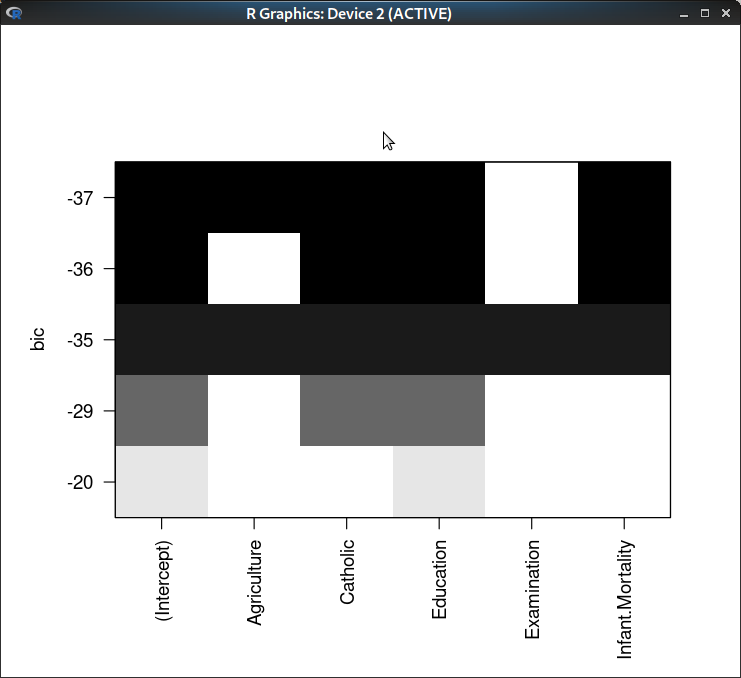
그래프에서 bic값이 가장 작은 숫자를 찾고, 이것과 연결된 설명변수 후보들 목록을 살펴보자. 검은색으로 표현된 것은 포함된 것, 흰색(공백)으로 표현된 것은 비포함된 것, 다른 말로 제거되어야 할 것이다. 그래프에서는 Examination 변수가 포함되지 않은 모형의 bic 값이 가장 작은 것을 알려준다.

LinearModel.2 <- lm(Fertility ~ Agriculture + Catholic + Education + Infant.Mortality, 
  data=swiss)              # Examination 변수를 제외한 추천 모형 만들기
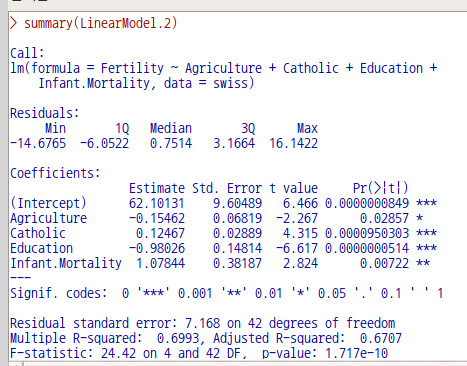
summary(LinearModel.2)     # LinearModel.2의 요약 정보 보기
plot(regsubsets(Fertility ~ Agriculture + Catholic + Education + Infant.Mortality, 
  data=swiss, nbest=1, nvmax=5), scale='bic')
                           # 추천된 하위셋 모델 점검하는 그림 만들기
Linux 사례 (MX 21)
Linux 사례 (MX 21)

carData::Duncan()

Linux 사례 (MX 21)
Linux 사례 (MX 21)

data(Duncan, package="carData")

R Commander의 상단에 있는 '데이터셋 보기' 버튼을 누르면, 아래와 같이 데이터셋 내부를 볼 수 있다.

Linux 사례 (MX 21)
Linux 사례 (MX 21)

?Duncan    # Duncan 데이터셋 도움말 보기

Duncan {carData} R Documentation

Duncan's Occupational Prestige Data

Description

The Duncan data frame has 45 rows and 4 columns. Data on the prestige and other characteristics of 45 U. S. occupations in 1950.

Usage

Duncan

Format

This data frame contains the following columns:

type

Type of occupation. A factor with the following levels: prof, professional and managerial; wc, white-collar; bc, blue-collar.

income

Percentage of occupational incumbents in the 1950 US Census who earned $3,500 or more per year (about $36,000 in 2017 US dollars).

education

Percentage of occupational incumbents in 1950 who were high school graduates (which, were we cynical, we would say is roughly equivalent to a PhD in 2017)

prestige

Percentage of respondents in a social survey who rated the occupation as “good” or better in prestige

Source

Duncan, O. D. (1961) A socioeconomic index for all occupations. In Reiss, A. J., Jr. (Ed.) Occupations and Social Status. Free Press [Table VI-1].

References

Fox, J. (2016) Applied Regression Analysis and Generalized Linear Models, Third Edition. Sage.

Fox, J. and Weisberg, S. (2019) An R Companion to Applied Regression, Third Edition, Sage.


[Package carData version 3.0-4 Index]

모델 > 수치적 진단 > 분산-팽창 요인

Models > Numerical diagnostics > Variance-inflation factors

Linux 사례 (MX 21)

선형모델에서 유의미한 설명변수들을 찾고 선택하는 것과 관련된 여러 기법이 있다. 아울러 설명변수들 사이의 관계, 서로에 대한 영향력의 크기에 대한 문제의식도 있다. 예를 들어, 데이터셋에 있는 여러개의 변수들 중에서 세개의 변수를 설명변수라고 선택을 했는데, 하나의 설명변수가 나머지에 큰 영향을 미치거나 또는 다른말로 변수들끼리의 연동성의 커서 독립된 설명변수들로 보기 어려운 경우가 발생할 수도 있다. 이 때 설명변수들의 독립성에 관한 점검 기법으로 '분산-팽창 요인(variance-inflation factor)'이 사용된다.

require(car)
?vif           # vif 함수는 car 패키지에 포함되어 있다.

carData 패키지에 있는 Duncan 데이터셋으로 연습해보자.

https://rcmdr.tistory.com/189


Duncan 데이터셋

data(Duncan, package="carData") R Commander의 상단에 있는 '데이터셋 보기' 버튼을 누르면, 아래와 같이 데이터셋 내부를 볼 수 있다. ?Duncan # Duncan 데이터셋 도움말 보기 Duncan {carData} R Documentat..

rcmdr.kr

아래와 같은 스크립트의 흐름이다.

data(Duncan, package="carData")
summary(Duncan)

LinearModel.1 <- lm(prestige ~ education + income, data=Duncan)
summary(LinearModel.1)
LinearModel.2 <- lm(prestige ~ education + income + type, data=Duncan)
summary(LinearModel.2)
vif(LinearModel.1)    # LinearModel.1의 분산팽창요인
round(cov2cor(vcov(LinearModel.1)), 3) # Correlations of parameter estimates
vif(LinearModel.2)    # LinearModel.2의 분산팽창요인
round(cov2cor(vcov(LinearModel.2)), 3) # Correlations of parameter estimates

'통계 > 적합성 모델 > 선형 모델...' 기능을 통하여 LinearModel.1과 LinearModel.2를 만든다.

Linux 사례 (MX 21)
Linux 사례 (MX 21)

LinearModel.1과 LinearModel.2의 분산-팽창 요인(Variance-inflation factors)을 차례로 계산한다.

Linux 사례 (Mx 21)
Linux 사례 (MX 21)

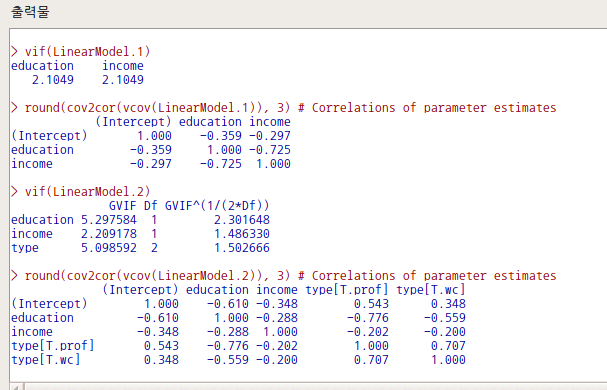
LinearModel.1과 LinearModel.2의 vif() 결과는 아래와 같다. LinearModel.1과 LinearModel.2의 vif() 결과가 다른 형식을 취한 이유는 LinearModel.2에 type이라는 요인형 변수가 있기 때문이다.

Linux 사례 (MX 21)


'Models > Numerical diagnostics' 카테고리의 다른 글

3. Durbin-Watson test for autocorrelation...  (0) 2022.06.21
4. RESET test for nonlinearity...  (0) 2022.06.20
6. Response transformation...  (0) 2022.06.20
5. Bonferroni outlier test  (0) 2022.06.18

+ Recent posts