통계 > 평균 > Paired t-검정...
Statistics > Means > Paired t-test...
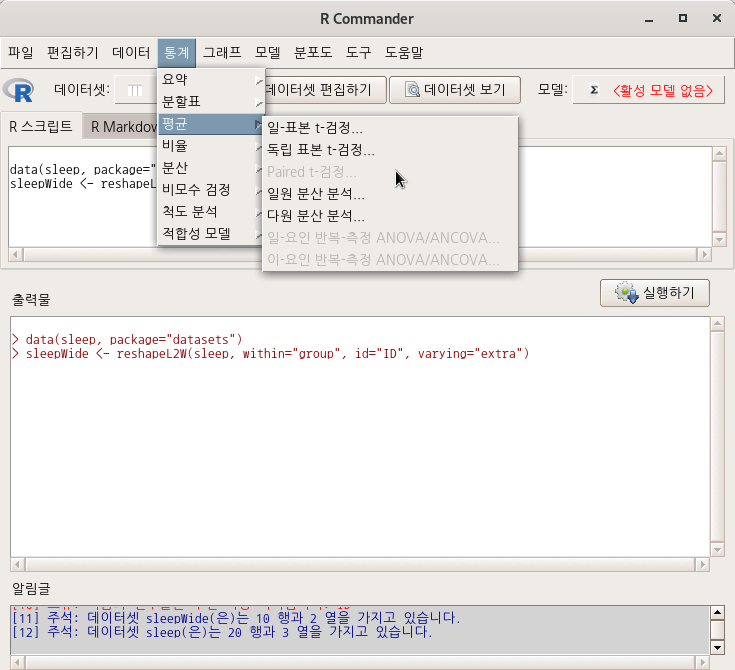
datasets 패키지에 포함된 sleep 데이터셋에는 extra라는 수치형 변수가 포함되어 있다. 수치형 변수가 하나만 있는 경우는 Paired t-검정을 사용할 수 없다. 10명이 각각 2개의 약을 복용한 후 group1, group2라는 집단 안에서 수면 시간의 변화를 측정한 데이터셋이다. reshape(), reshapeL2W() 등의 함수를 사용하여 extra라는 수치형 변수를 group1 , group2 별로 두개의 수치형 변수로 변환시켜야 한다. 변환이 되면 <Statistics : Means : Paired t-test> 기능이 활성화된다.

13. Reshape data set from long to wide format...
데이터 > 활성 데이터셋 > 긴 형식에서 넓은 형식으로 데이터셋 모양바꾸기... Data > Active data set > Reshape data set from long to wide format... 간혹, ID를 갖는 주체(subject, 주로 사람 또는 집단의..
rcmdr.kr
extra 변수를 두개의 집단 X1, X2 로 이미 나눈 상황이다. X1과 X2를 각각 <첫째 변수>와 <둘째 변수>에 선택하자.

<선택기능>창 추가 선택 사항들이 있다. 기본 선택을 이용하자.

> with(sleepWide, (t.test(X1, X2, alternative='two.sided', conf.level=.95, paired=TRUE)))아래의 함수 사용과 같은 결과를 얻는다.
t.test(Pair(X1, X2) ~ 1, data = sleepWide)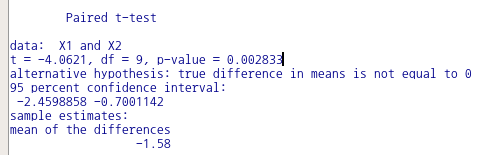
?t.test  # stats 패키지의 t.test 도움말 보기

require(graphics)

t.test(1:10, y = c(7:20))      # P = .00001855
t.test(1:10, y = c(7:20, 200)) # P = .1245    -- NOT significant anymore

## Classical example: Student's sleep data
plot(extra ~ group, data = sleep)
## Traditional interface
with(sleep, t.test(extra[group == 1], extra[group == 2]))

## Formula interface
t.test(extra ~ group, data = sleep)

## Formula interface to one-sample test
t.test(extra ~ 1, data = sleep)

## Formula interface to paired test
## The sleep data are actually paired, so could have been in wide format:
sleep2 <- reshape(sleep, direction = "wide",
                  idvar = "ID", timevar = "group")
t.test(Pair(extra.1, extra.2) ~ 1, data = sleep2)'Statistics > Means' 카테고리의 다른 글
| 6. One-factor repeated-measures ANOVA/ANCOVA... (0) | 2022.06.23 |
|---|---|
| 5. Multi-way ANOVA... (0) | 2022.03.13 |
| 4. One-way ANOVA... (0) | 2022.03.07 |
| 2. Independent samples t-test... (0) | 2022.03.07 |
| 1. Single-sample t-test... (0) | 2022.03.07 |


