datasets::warpbreaks()

Linux 사례 (MX 21)

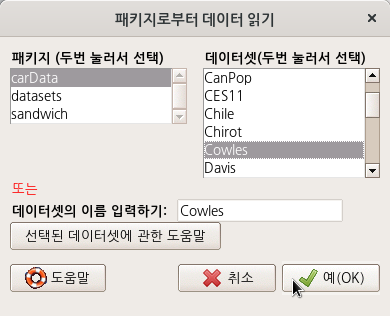
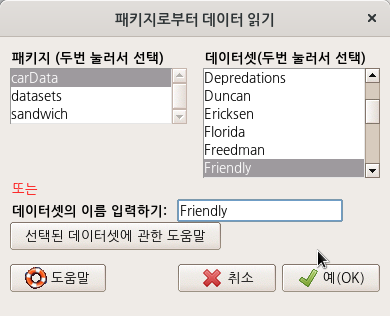
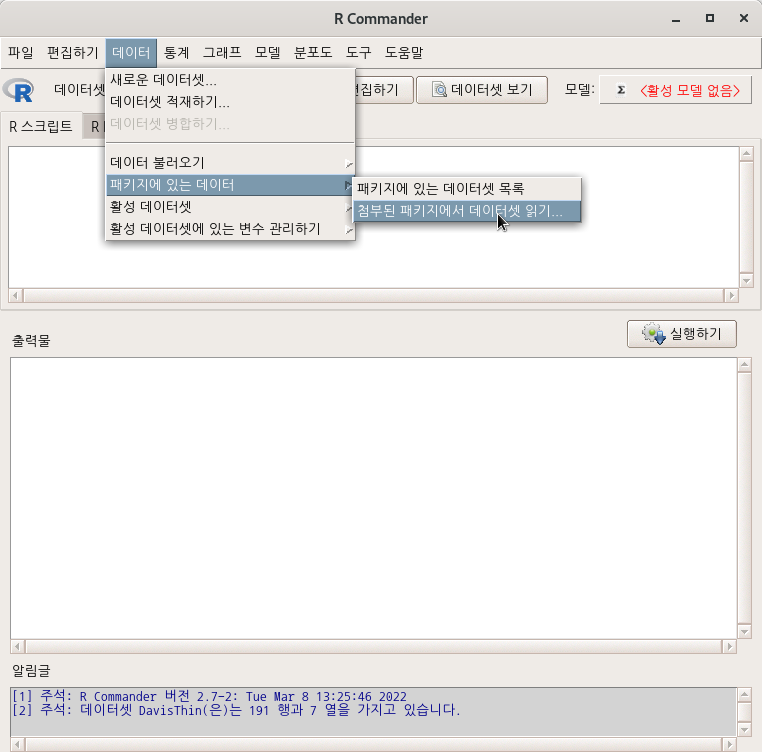
data(warpbreaks, package="datasets") # 데이터셋 불러오기	
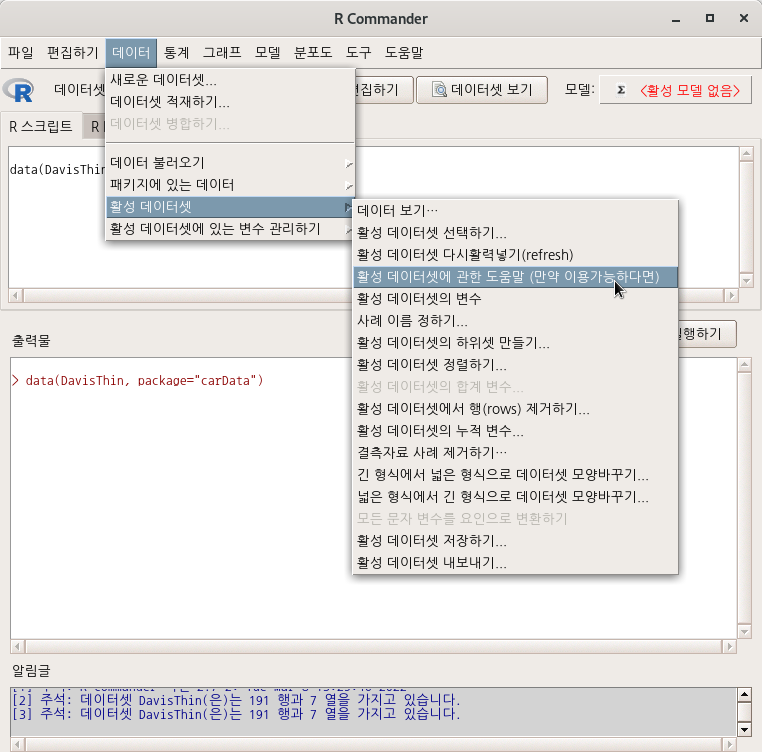
help("warpbreaks")                   # 데이터셋 도움말 보기
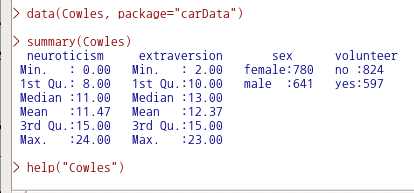
summary(warpbreaks)                  # 데이터셋 통계 요약 보기

Linux 사례 (MX 21)

R Commander 화면 상단 우측에 있는 <데이터셋 보기> 버튼을 누른다. 아래와 같이 warpbreaks 데이터셋의 내부 구성을 볼 수 있다.

Linux 사례 (MX 21)


warpbreaks {datasets} R Documentation

The Number of Breaks in Yarn during Weaving

Description

This data set gives the number of warp breaks per loom, where a loom corresponds to a fixed length of yarn.

Usage

warpbreaks

Format

A data frame with 54 observations on 3 variables.

[,1] breaks numeric The number of breaks
[,2] wool factor The type of wool (A or B)
[,3] tension factor The level of tension (L, M, H)

There are measurements on 9 looms for each of the six types of warp (AL, AM, AH, BL, BM, BH).

Source

Tippett, L. H. C. (1950) Technological Applications of Statistics. Wiley. Page 106.

References

Tukey, J. W. (1977) Exploratory Data Analysis. Addison-Wesley.

McNeil, D. R. (1977) Interactive Data Analysis. Wiley.

See Also

xtabs for ways to display these data as a table.

Examples

require(stats); require(graphics)
summary(warpbreaks)
opar <- par(mfrow = c(1, 2), oma = c(0, 0, 1.1, 0))
plot(breaks ~ tension, data = warpbreaks, col = "lightgray",
     varwidth = TRUE, subset = wool == "A", main = "Wool A")
plot(breaks ~ tension, data = warpbreaks, col = "lightgray",
     varwidth = TRUE, subset = wool == "B", main = "Wool B")
mtext("warpbreaks data", side = 3, outer = TRUE)
par(opar)
summary(fm1 <- lm(breaks ~ wool*tension, data = warpbreaks))
anova(fm1)

[Package datasets version 4.0.4 Index]

'Dataset_info > warpbreaks' 카테고리의 다른 글

warpbreaks 데이터셋 예제  (0) 2022.06.25

carData::Adler

Linux 사례 (MX 21)

데이터 > 패키지에 있는 데이터 > 첨부된 패키지에서 데이터셋 읽기... 기능을 선택하면, 위와 같은 메뉴 창을 보게된다.

carData를 선택하여 두번 클릭하면, 오른쪽에 carData 패키지에 내장된 데이터셋 목록이 등장한다. Adler 데이터셋을 선택한다.

Linux 사례 (MX 21)

data(Adler, package="carData")  # Adler 데이터셋 활성화시키기
help("Adler", package="carData")# 도움말파일 열기

Linux사례 (MX 21)


Adler {carData} R Documentation

Experimenter Expectations

Description

The Adler data frame has 108 rows and 3 columns.

The “experimenters” were the actual subjects of the study. They collected ratings of the apparent success of people in pictures who were pre-selected for their average appearance of success. The experimenters were told prior to collecting data that particular subjects were either high or low in their tendency to rate appearance of success, and were instructed to get good data, scientific data, or were given no such instruction. Each experimenter collected ratings from 18 randomly assigned subjects. This version of the Adler data is taken from Erickson and Nosanchuk (1977). The data described in the original source, Adler (1973), have a more complex structure.

Usage

Adler

Format

This data frame contains the following columns:

instruction

a factor with levels: good, good data; none, no stress; scientific, scientific data.

expectation

a factor with levels: high, expect high ratings; low, expect low ratings.

rating

The average rating obtained.

Source

Erickson, B. H., and Nosanchuk, T. A. (1977) Understanding Data. McGraw-Hill Ryerson.

References

Adler, N. E. (1973) Impact of prior sets given experimenters and subjects on the experimenter expectancy effect. Sociometry 36, 113–126.

carData::Cowles

Linux 사례 (MX 21)

data(Cowles, package="carData")

Linux 사례 (MX 21)

help("Cowles")

Linux 사례 (MX 21)


Cowles {carData} R Documentation

Cowles and Davis's Data on Volunteering

Description

The Cowles data frame has 1421 rows and 4 columns. These data come from a study of the personality determinants of volunteering for psychological research.

Usage

Cowles

Format

This data frame contains the following columns:

neuroticism

scale from Eysenck personality inventory

extraversion

scale from Eysenck personality inventory

sex

a factor with levels: female; male

volunteer

volunteeing, a factor with levels: no; yes

Source

Cowles, M. and C. Davis (1987) The subject matter of psychology: Volunteers. British Journal of Social Psychology 26, 97–102.


[Package carData version 3.0-5 Index]

carData::Friendly()

Linux 사례 (MX 21)

data(Friendly, package="carData")

Linux 사례 (MX 21)

help("Friendly")
Friendly {carData} R Documentation

Format Effects on Recall

Description

The Friendly data frame has 30 rows and 2 columns. The data are from an experiment on subjects' ability to remember words based on the presentation format.

Usage

Friendly

Format

This data frame contains the following columns:

condition

A factor with levels: Before, Recalled words presented before others; Meshed, Recalled words meshed with others; SFR, Standard free recall.

correct

Number of words correctly recalled, out of 40 on final trial of the experiment.

Source

Friendly, M. and Franklin, P. (1980) Interactive presentation in multitrial free recall. Memory and Cognition 8 265–270 [Personal communication from M. Friendly].

References

Fox, J. (2016) Applied Regression Analysis and Generalized Linear Models, Third Edition. Sage.

Fox, J. and Weisberg, S. (2019) An R Companion to Applied Regression, Third Edition, Sage.


[Package carData version 3.0-5 Index]

MASS::birthwt

Linux 사례 (MX 21)

data(birthwt, package="MASS")

birthwt 데이터셋이 활성화된 후, <데이터셋 보기> 버튼을 누르면 아래와 같이 내부 구성을 볼 수 있다:

Linux 사례(MX 21)

help("birthwt")

Linux 사례 (MX 21)


birthwt {MASS} R Documentation

Risk Factors Associated with Low Infant Birth Weight

Description

The birthwt data frame has 189 rows and 10 columns. The data were collected at Baystate Medical Center, Springfield, Mass during 1986.

Usage

birthwt

Format

This data frame contains the following columns:

low

indicator of birth weight less than 2.5 kg.

age

mother's age in years.

lwt

mother's weight in pounds at last menstrual period.

race

mother's race (1 = white, 2 = black, 3 = other).

smoke

smoking status during pregnancy.

ptl

number of previous premature labours.

ht

history of hypertension.

ui

presence of uterine irritability.

ftv

number of physician visits during the first trimester.

bwt

birth weight in grams.

Source

Hosmer, D.W. and Lemeshow, S. (1989) Applied Logistic Regression. New York: Wiley

References

Venables, W. N. and Ripley, B. D. (2002) Modern Applied Statistics with S. Fourth edition. Springer.

Examples

bwt <- with(birthwt, {
race <- factor(race, labels = c("white", "black", "other"))
ptd <- factor(ptl > 0)
ftv <- factor(ftv)
levels(ftv)[-(1:2)] <- "2+"
data.frame(low = factor(low), age, lwt, race, smoke = (smoke > 0),
           ptd, ht = (ht > 0), ui = (ui > 0), ftv)
})
options(contrasts = c("contr.treatment", "contr.poly"))
glm(low ~ ., binomial, bwt)

[Package MASS version 7.3-55 Index]

bwt.RData
0.00MB

'Dataset_info > birthwt' 카테고리의 다른 글

bwt 데이터셋  (0) 2022.06.24

Rcmdr > etc > Nations.txt (컴파일 이후)

Rcmdr > inst > etc > Nations.txt (소스에서)

Nations.txt
0.01MB

Rcmdr 패키지에는 Getting-Started-with-the-Rcmdr.pdf 라는 사용법 소개 파일이 포함되어 있다. 이 파일에서 예제용으로 활용하는 데이터셋이 Nations.txt 이다. 이 파일 또한 Rcmdr 패키지에 포함되어 있다.


아래와 같이 내부 구성을 볼 수 있다.

Linux 사례 (MX 21)

Nations 데이터셋의 요약 정보는 아래와 같다:

Linux 사례(MX 21)

TFR (출생율, the total fertility rate, expressed as number of children per woman),

contraception (피임율, the rate of contraceptive use among married women, in percent),

infant.mortality (영유아 사망율, the infant-mortality rate per 1000 live births),

GDP (국내 총생산, gross domestic product per capita, in U.S. dollars),

region (대륙, one line per country)

datasets::USArrests()

Linux 사례(MX 21)
Linux 사례 (MX 21)

data(USArrests, package="datasets")

R Commander 화면 상단에서 <데이터셋 보기> 버튼을 누르면 아래와 같은 내부 구성을 확인할 수 있다.

Linux 사례 (MX 21)

help("USArrests")

USArrests {datasets} R Documentation

Violent Crime Rates by US State

Description

This data set contains statistics, in arrests per 100,000 residents for assault, murder, and rape in each of the 50 US states in 1973. Also given is the percent of the population living in urban areas.

Usage

USArrests

Format

A data frame with 50 observations on 4 variables.

[,1] Murder numeric Murder arrests (per 100,000)
[,2] Assault numeric Assault arrests (per 100,000)
[,3] UrbanPop numeric Percent urban population
[,4] Rape numeric Rape arrests (per 100,000)

Note

USArrests contains the data as in McNeil's monograph. For the UrbanPop percentages, a review of the table (No. 21) in the Statistical Abstracts 1975 reveals a transcription error for Maryland (and that McNeil used the same “round to even” rule that R's round() uses), as found by Daniel S Coven (Arizona).

See the example below on how to correct the error and improve accuracy for the ‘<n>.5’ percentages.

Source

World Almanac and Book of facts 1975. (Crime rates).

Statistical Abstracts of the United States 1975, p.20, (Urban rates), possibly available as https://books.google.ch/books?id=zl9qAAAAMAAJ&pg=PA20.

References

McNeil, D. R. (1977) Interactive Data Analysis. New York: Wiley.

See Also

The state data sets.

Examples

summary(USArrests)

require(graphics)
pairs(USArrests, panel = panel.smooth, main = "USArrests data")

## Difference between 'USArrests' and its correction
USArrests["Maryland", "UrbanPop"] # 67 -- the transcription error
UA.C <- USArrests
UA.C["Maryland", "UrbanPop"] <- 76.6

## also +/- 0.5 to restore the original  <n>.5  percentages
s5u <- c("Colorado", "Florida", "Mississippi", "Wyoming")
s5d <- c("Nebraska", "Pennsylvania")
UA.C[s5u, "UrbanPop"] <- UA.C[s5u, "UrbanPop"] + 0.5
UA.C[s5d, "UrbanPop"] <- UA.C[s5d, "UrbanPop"] - 0.5

## ==> UA.C  is now a *C*orrected version of  USArrests

[Package datasets version 4.1.0 Index]

'Dataset_info > USArrests' 카테고리의 다른 글

USArrests 데이터셋 예제  (0) 2022.06.25

carData > Prestige

Linux 사례 (MX 21)
Linux 사례 (MX 21)

data(Prestige, package="carData")

Linux 사례 (MX 21)

help("Prestige")

Prestige {carData} R Documentation

Prestige of Canadian Occupations

Description

The Prestige data frame has 102 rows and 6 columns. The observations are occupations.

Usage

Prestige

Format

This data frame contains the following columns:

education

Average education of occupational incumbents, years, in 1971.

income

Average income of incumbents, dollars, in 1971.

women

Percentage of incumbents who are women.

prestige

Pineo-Porter prestige score for occupation, from a social survey conducted in the mid-1960s.

census

Canadian Census occupational code.

type

Type of occupation. A factor with levels (note: out of order): bc, Blue Collar; prof, Professional, Managerial, and Technical; wc, White Collar.

Source

Canada (1971) Census of Canada. Vol. 3, Part 6. Statistics Canada [pp. 19-1–19-21].

Personal communication from B. Blishen, W. Carroll, and C. Moore, Departments of Sociology, York University and University of Victoria.

References

Fox, J. (2016) Applied Regression Analysis and Generalized Linear Models, Third Edition. Sage.

Fox, J. and Weisberg, S. (2019) An R Companion to Applied Regression, Third Edition, Sage.


[Package carData version 3.0-4 Index]

'Dataset_info > Prestige' 카테고리의 다른 글

Prestige.csv  (0) 2022.02.22

carData > Moore

Linux 사례 (MX 21)
Linux 사례 (MX 21)

data(Moore, package="carData")

Linux 사례 (MX 21)

help("Moore")

Moore {carData} R Documentation

Status, Authoritarianism, and Conformity

Description

The Moore data frame has 45 rows and 4 columns. The data are for subjects in a social-psychological experiment, who were faced with manipulated disagreement from a partner of either of low or high status. The subjects could either conform to the partner's judgment or stick with their own judgment.

Usage

Moore

Format

This data frame contains the following columns:

partner.status

Partner's status. A factor with levels: high, low.

conformity

Number of conforming responses in 40 critical trials.

fcategory

F-Scale Categorized. A factor with levels (note levels out of order): high, low, medium.

fscore

Authoritarianism: F-Scale score.

Source

Moore, J. C., Jr. and Krupat, E. (1971) Relationship between source status, authoritarianism and conformity in a social setting. Sociometry 34, 122–134.

Personal communication from J. Moore, Department of Sociology, York University.

References

Fox, J. (2016) Applied Regression Analysis and Generalized Linear Models, Third Edition. Sage.

Fox, J. and Weisberg, S. (2019) An R Companion to Applied Regression, Third Edition, Sage.

carData::DavisThin()

Linux 사례 (MX 21)
Linux 사례 (MX 21)
Linux 사례 (MX 21)

help("DavisThin")

DavisThin {carData} R Documentation

Davis's Data on Drive for Thinness

Description

The DavisThin data frame has 191 rows and 7 columns. This is part of a larger dataset for a study of eating disorders. The seven variables in the data frame comprise a "drive for thinness" scale, to be formed by summing the items.

Usage

DavisThin

Format

This data frame contains the following columns:

DT1

a numeric vector

DT2

a numeric vector

DT3

a numeric vector

DT4

a numeric vector

DT5

a numeric vector

DT6

a numeric vector

DT7

a numeric vector

Source

Davis, C., G. Claridge, and D. Cerullo (1997) Personality factors predisposing to weight preoccupation: A continuum approach to the association between eating disorders and personality disorders. Journal of Psychiatric Research 31, 467–480. [personal communication from the authors.]

References

Fox, J. and Weisberg, S. (2019) An R Companion to Applied Regression, Third Edition, Sage.


[Package carData version 3.0-5 Index]

+ Recent posts