모델 > 그래프 > 성분 + 잔차 그림...
Models > Graphs > Component + residual plots...

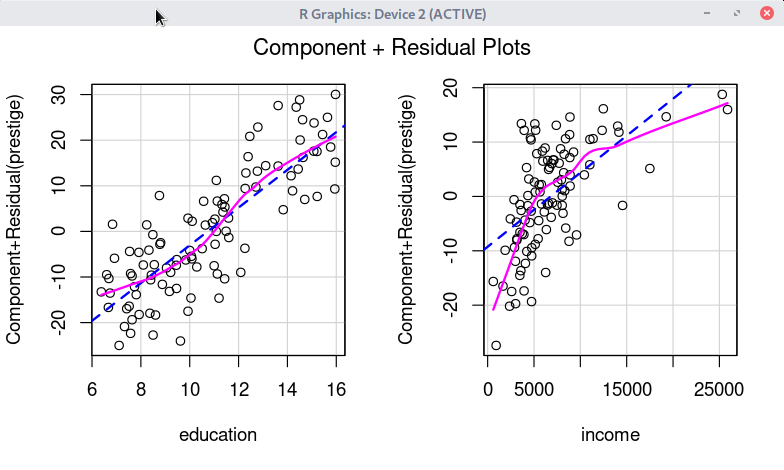
데이터셋이 활성화되고 통계적으로 분석된 모형이 만들어진 경우, '모델 > 그래프 > 성분 + 잔차 그림...' 메뉴 기능을 사용할 수 있다. carData 패키지의 Prestige 데이터셋을 이용하여 연습해보자.
먼저 Prestige 데이터셋을 활성화 시킨다. '데이터 > 패키지에 있는 데이터 > 첨부된 패키지에서 데이터셋 읽기...' 메뉴 기능을 통해서 carData 패키지에서 Prestige 데이터셋을 찾아서 선택하면 된다. 그러면, R Commander 상단의 <활성 데이터셋 없음> 버튼이 'Prestige'로 바뀐다.
Prestige 데이터셋을 이용하여 LinearModel.1, LinearModel.2 라는 두 개의 모형을 차례로 만든다. '통계 > 적합성 모델 > 선형 모델...' 메뉴 기능을 이용할 수 있다.
LinearModel.1 <- lm(prestige ~ education + log(income), data=Prestige)
summary(LinearModel.1)
LinearModel.2 <- lm(prestige ~ education + income, data=Prestige)
summary(LinearModel.2)
그리고 두 모형의 '성분 + 잔차 그림...'을 차례로 만든다. 먼저 R Commander 상단의 <모델: LinearModel.1> 을 선택한 후, '모델 > 그래프 > 성분 + 잔차 그림...' 메뉴 기능을 선택한다.
crPlots(LinearModel.1, smooth=list(span=0.5))
crPlots(LinearModel.2, smooth=list(span=0.5))
'Models > Graphs' 카테고리의 다른 글
| 6. Influence index plot... (0) | 2022.06.21 |
|---|---|
| 2. Residual quantile-comparison plot... (0) | 2022.06.21 |
| 5. Influence plot... (0) | 2022.06.21 |
| 4. Added-variable plots... (0) | 2022.06.20 |
| 7. Effect plots... (0) | 2022.03.09 |