통계 > 비모수 검정 > 이-표본 Wilcoxon 검정...

Statistics > Nonparametric tests > Two-sample Wilcoxon test...

Windows 사례 (10 Pro)

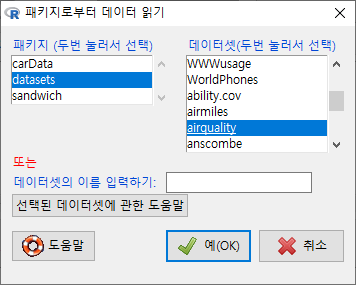
'통계 > 비모수 검정 > 이-표본 Wilcoxon 검정...' 기능을 이용하기 위해서 데이터셋을 선택하고, 정비해보자. datasets 패키지에 있는 airquality 데이터셋을 선택하고, 그 안에 있는 변수 Month 사례 값들 중에서 5월, 8월에 해당하는 5, 8을 선택한 하위 데이터셋을 만들고, airquality.sub라 이름 붙이자. 그리고, 5, 8을 요인화 시켜서, May, August라고 수준을 만들자.

https://rcmdr.kr/100


airquality 데이터셋

datasets > airquality R이 시작될 때, datasets 패키지가 자동으로 호출된다. 따라서 R Commander를 실행할 때, datasets 패키지는 첨부 패키지화되어 메뉴창을 통해서 내부 데이터셋을 찾고 불러올 수 있다.

rcmdr.kr

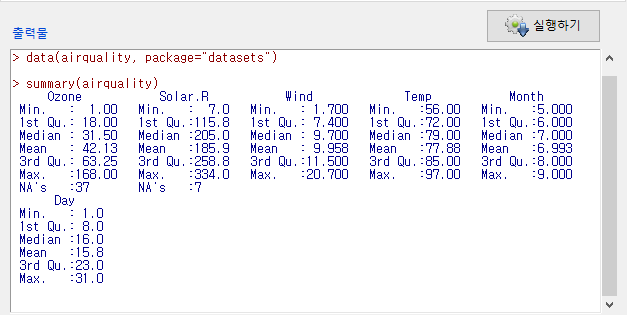
data(airquality, package="datasets") # airquality 데이터셋 불러오기
airquality.sub <- subset(airquality, subset=Month %in% c(5, 8)) 
                                     # 5월, 8월만 포함하는 하위셋 만들기
summary(airquality.sub)
airquality.sub <- within(airquality.sub, {
  Month.f <- factor(Month, labels=c('May','August'))
})                                   # Month.f라는 요인형 변수 만들기

집단 변수인 Month.f는 두개의 수준을 갖고 있고, 이 두개의 수준을 기준으로 Ozone을 비교하는 것이다.

Windows 사례 (10 Pro)

<선택기능> 창에 있는 기본 설정을 우선 그대로 사용해보자. 향후 데이터셋과 변수에 대한 이해력이 높아지면, 다양한 선택을 할 수 있다.

Windows 사례 (10 Pro)

Tapply(Ozone ~ Month.f, median, na.action=na.omit, data=airquality.sub) 
  # medians by group
wilcox.test(Ozone ~ Month.f, alternative="two.sided", data=airquality.sub)

Windows 사례 (10 Pro)

'Statistics > Nonparametric tests' 카테고리의 다른 글

3. Paired-samples Wilcoxon test...  (0) 2022.03.21
2. Single-sample Wilcoxon test...  (0) 2022.03.21
5. Friedman rank-sum test...  (0) 2022.03.20
4. Kruskal-Wallis test...  (0) 2022.03.09

datasets::airquality()

Linux 사례 (MX 21)

R이 시작될 때, datasets 패키지가 자동으로 호출된다. 따라서 R Commander를 실행할 때, datasets 패키지는 첨부 패키지화되어 메뉴창을 통해서 내부 데이터셋을 찾고 불러올 수 있다.

메뉴창에서 순서대로 데이터 > 패키지에 있는 데이터 > 첨부된 패키지에서 데이터셋 읽기... 를 선택하면 다음과 같은 창이 등장한다.

Windows 사례

출력창을 보면, airquality라는 데이터셋에는 6개의 변수가 있고, 각 변수는 수치형 정보를 담고 있다.

Windows 사례

Month 변수는 최소 5에서 최대 9로 값이 있는데, 정확히는 5월부터 9월까지일 것이다. 한달 한달을 뜻하는 월(month)은 5월이 9월보다 크다고 할 수 없고, 5월, 6월, 7월, 8월, 9월 등으로 개체화되어 분리된다. 다시 말하면, 요인형 변수가 되어야 한다는 뜻이다.

그럼 왜, airqualty 데이터셋의 Month 변수는 수치형으로 되어 있을까. 원자료를 R의 데이터셋으로 불러오는 과정에서 해당 변수의 요인화과정이 생략되었을 것이다.


airquality {datasets} R Documentation

New York Air Quality Measurements

Description

Daily air quality measurements in New York, May to September 1973.

Usage

airquality

Format

A data frame with 153 observations on 6 variables.

[,1] Ozone numeric Ozone (ppb)
[,2] Solar.R numeric Solar R (lang)
[,3] Wind numeric Wind (mph)
[,4] Temp numeric Temperature (degrees F)
[,5] Month numeric Month (1--12)
[,6] Day numeric Day of month (1--31)

Details

Daily readings of the following air quality values for May 1, 1973 (a Tuesday) to September 30, 1973.

  • Ozone: Mean ozone in parts per billion from 1300 to 1500 hours at Roosevelt Island
  • Solar.R: Solar radiation in Langleys in the frequency band 4000–7700 Angstroms from 0800 to 1200 hours at Central Park
  • Wind: Average wind speed in miles per hour at 0700 and 1000 hours at LaGuardia Airport
  • Temp: Maximum daily temperature in degrees Fahrenheit at La Guardia Airport.

Source

The data were obtained from the New York State Department of Conservation (ozone data) and the National Weather Service (meteorological data).

References

Chambers, J. M., Cleveland, W. S., Kleiner, B. and Tukey, P. A. (1983) Graphical Methods for Data Analysis. Belmont, CA: Wadsworth.

Examples

require(graphics)
pairs(airquality, panel = panel.smooth, main = "airquality data")

[Package datasets version 4.0.4 Index]

'Dataset_info > airquality' 카테고리의 다른 글

airquality 데이터셋 예제  (0) 2022.06.24

+ Recent posts