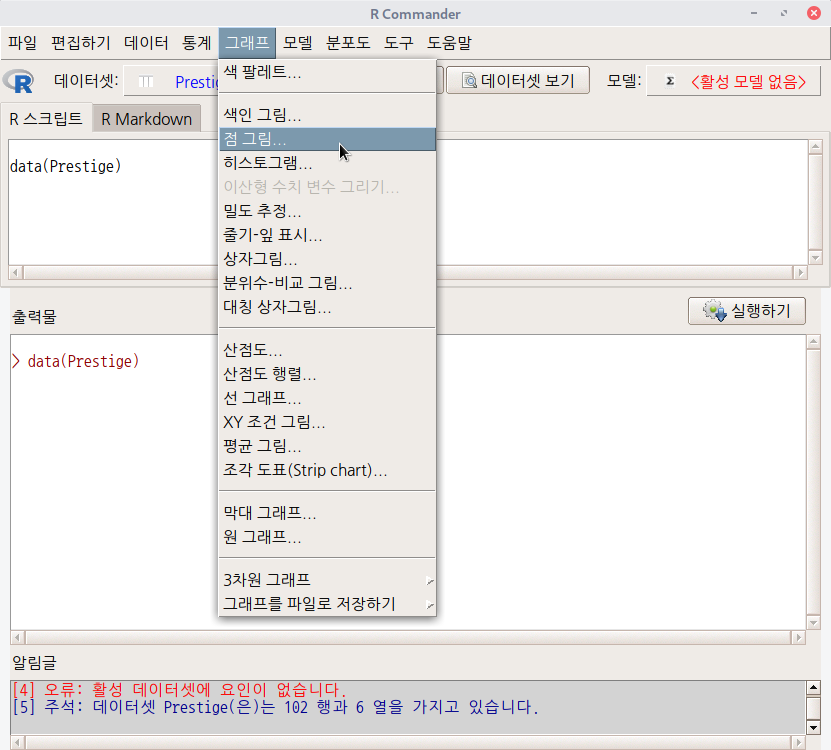
그래프 > 점 그림...
Graphs > Dot plot...

carData 패키지에 있는 Prestige 데이터셋을 이용하여 연습해보자. '데이터 > 패키지에 있는 데이터> 첨부된 패키지에서 데이터셋 읽기...'메뉴 기능을 사용하여 carData 패키지에 포함된 Prestige 데이터셋을 불러온다.
Prestige 데이터셋
carData > Prestige data(Prestige, package="carData") help("Prestige")
rcmdr.kr
데이터셋이 활성화되면, '그래프 > 점 그림...'메뉴 기능도 활성화된다.
Prestige 데이터셋에 있는 변수들 중에 prestige 변수는 '직업의 사회적 권위'에 관련 값을 담고 있다. Prestige 데이터셋에 있는 변수 type은 '직업유형'을 나타내는데 'bc', 'prof', 'wc' 등의 요인들을 갖고 있다. 블루칼라, 전문직, 화이트칼라를 뜻한다.
data(Prestige, package="carData")
with(Prestige, Dotplot(prestige, bin=FALSE))
with(Prestige, Dotplot(prestige, by=type, bin=FALSE))
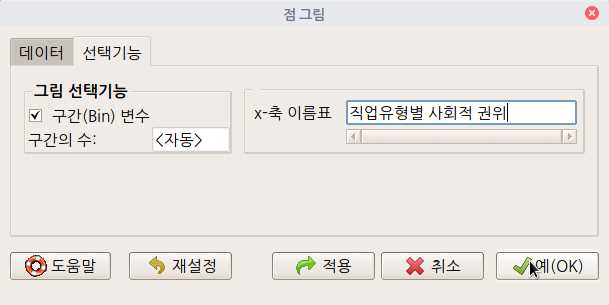
with(Prestige, Dotplot(prestige, by=type, bin=TRUE, breaks="Sturges",
xlab="직업유형별 사회적 권위"))Dotplot() 함수를 사용하여 그래프를 출력한다. 함수에 포함된 인자들을 살펴보자. 아래와 같이 메뉴창에서 선택사항들을 결정하고, 필요사항을 입력하자.


?Dotplot  # RcmdrMisc 패키지의 Dotplot 도움말 보기

if (require(car)){
  data(Duncan)
  with(Duncan, {
    Dotplot(education)
    Dotplot(education, bin=TRUE)
    Dotplot(education, by=type)
    Dotplot(education, by=type, bin=TRUE)
  })
}